The Data Foundation for AI Trading—What Should You Feed Your Model?
This lesson starts with "how data determines the upper limit of strategy," systematically breaking down the types of data required for AI crypto trading, feature construction methods, and common data pitfalls, helping learners establish a research starting point suitable for live trading.
Introduction
In Lesson 1, we discussed why AI is becoming the new infrastructure for crypto trading. The key question that follows is: no matter how powerful AI is, it can only operate within the boundaries of the data you provide.
Many strategies fail not because the model is too simple, but because there are directional errors at the data layer: either data quality is insufficient, feature design is distorted, or validation methods are biased.
Therefore, real AI trading often doesn’t start with “choosing a model,” but with “building the data foundation.” What you feed the model determines what it can see; what it can see determines what judgments it can make.
1. Establish a Consensus First: More data isn’t always better—data with causal structure is better
Traders new to AI often fall into the “data hoarding” mindset: grabbing every piece of data possible, believing more features make it easier to find alpha.
In reality, low-quality, noisy, weakly correlated data actually reduces model stability. The reason is simple:
- The model “learns false patterns” from noise
- When out-of-sample environments change, false patterns are the first to fail
- The more redundant the features, the harder the strategy is to explain and maintain
So, the first principle of building a data system is:
Select data around trading problems—not hunt for problems around data itself.
If you’re solving “short-term direction prediction,” prioritize microstructure and sentiment shocks; if you’re working on “medium-term position management,” focus more on liquidity, volatility structure, and macro factors.
2. Four Core Data Sources for AI Crypto Trading
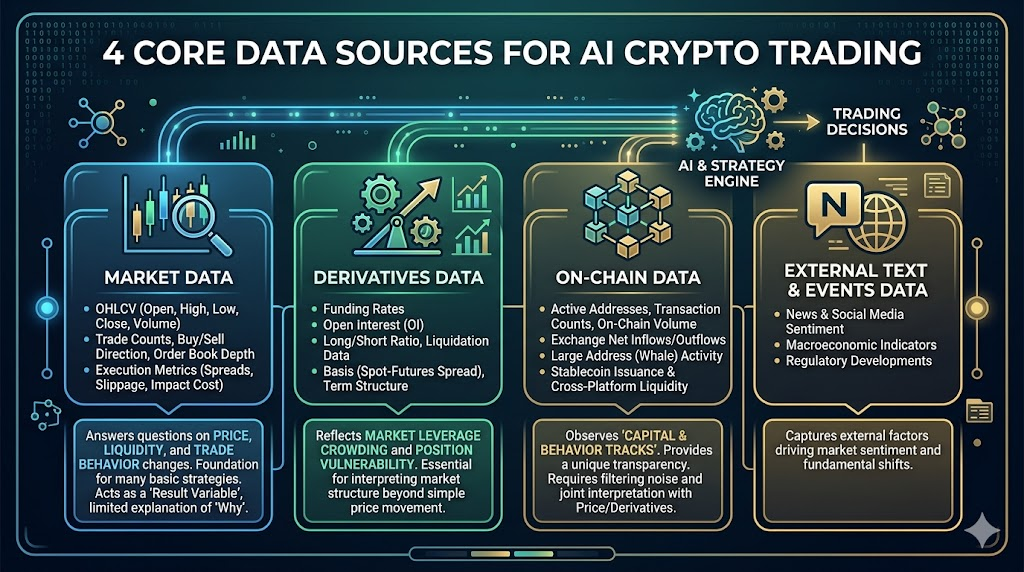
In crypto markets, the most valuable data usually comes from four layers: market data, derivatives, on-chain, and external information.
Market Data
This is the foundational layer for all strategies, including:
- OHLCV (Open, High, Low, Close, Volume)
- Number of trades, buy/sell direction, order book depth
- Spread, slippage, execution cost indicators
It answers: how prices change, how liquidity changes, how trading behavior changes.
Many basic strategies can be built with just market data, but its limitation is: it’s more like a “result variable,” with limited explanatory power for “why things change.”
Derivatives Data
Especially crucial in crypto markets, including:
- Funding rate
- Open interest
- Long/short account ratio, liquidation data
- Basis (spot-contract price difference), term structure
This data reflects market leverage crowding and position vulnerability.
For example, “price rising + OI rising + high funding rate” vs. “price rising + OI falling” mean completely different things. The former may signal trend strengthening or leverage crowding; the latter is more likely driven by short covering.
Without derivatives dimension, it’s hard to judge position structure behind market moves.
On-chain Data
A key advantage distinguishing crypto markets from traditional ones, including:
- Active addresses, number of transactions, on-chain transfer size
- Exchange net inflow/outflow
- Large address (whale) behavior
- Stablecoin issuance and cross-platform flows
The value of on-chain data lies in observing “capital and behavioral trajectories,” but the challenge is delayed interpretation and noise filtering.
For example, increased exchange inflow could mean preparing to sell or preparing to hedge. On-chain data must be interpreted together with price structure and derivatives data—using it alone easily leads to misjudgment.
External Text and Event Data (News/Social/Macro)
Includes news, social media discussion heat, policy events, macro data release timings.
These are more like “shock source data”: explaining why volatility suddenly spikes or trends shift briefly.
But this type of data has obvious issues: highly subjective, noisy, mixed true/false information.
Therefore, external text is better used as “risk alert factors” and “event filters,” not recommended as sole entry signals.
3. From Raw Data to Tradable Features: Feature Engineering Is the Real Strategy Divider
AI doesn’t directly understand “market narratives”; it only recognizes feature patterns.
So the second step isn’t rushing to train models but transforming raw data into learnable, verifiable, tradable features.
Common useful features can be grouped into four categories:
- Trend Features: momentum, moving average slope, breakout strength
- Volatility Features: historical volatility, range amplitude, volatility jumps
- Structural Features: funding rate deviation, OI change rate, basis change
- Behavioral Features: on-chain net flow changes, news sentiment shocks, abnormal social media heat
The key isn’t “flashy features,” but three standards:
- Does it have economic meaning (not just mathematical stitching)
- Is it obtainable at real-time points (no future info)
- Can it persist across different market phases (bull/bear/consolidation without excessive distortion)
4. Label Design: What You Ask the Model to Predict Determines What It Learns
Many people default to having the model predict “the next K-line up/down,” but that’s not necessarily optimal.
Trading objectives can have various label forms:
- Classification labels: whether future n-period returns exceed threshold
- Regression labels: future n-period returns
- Risk labels: whether large drawdown occurs in future n periods
- Structural labels: whether volatility expands or funding rate becomes extreme in future
If your strategy goal is to “avoid large drawdowns” but you use “short-term price direction” as a label, no matter how accurate the model is, it may not be useful.
So labels should match strategy goals: whatever profit you seek in trading, have the model learn that target.
5. The Key to Data Validation: In Time Series World, Validation Methods Matter More Than Models
In typical machine learning tasks, randomly shuffling training and test sets is common and reasonable; but in trading this causes severe distortion.
Because markets have time-dependent structure—future information must never “leak” into the past.
AI trading should adhere to three validation rules at minimum:
- Split training/validation/testing by time—not random shuffle
- Out-of-sample validation must cover different volatility environments
- Use rolling window (walk-forward) to simulate real deployment
Many “backtest miracle strategies” collapse not because markets worsen but because testing methods were optimistically biased from the start.
6. Five Common Data Pitfalls
Look-ahead Bias
Using unavailable-at-the-time data leads to inflated results.
Survivorship Bias
Training only on surviving coins or platforms—ignoring failed samples.
Over-cleaning
Deleting real noise as dirty data—model loses adaptability to extreme markets.
Feature Leakage
Features implicitly contain label information—making model appear overly accurate.
Frequency Mismatch
Forcing low-frequency on-chain features into high-frequency trading tasks—causing false signals.
These issues don’t trigger alarms during backtesting but will quickly magnify in live trading.
A Practical Data Workflow: Start Small and Stable, Then Expand
For course learners, the safest approach isn’t to start with a “full-market all-factor mega-model,” but begin with a minimal viable data framework:
- Choose a single asset (like BTC or ETH)
- Start with market + derivatives data types
- Build 10–20 basic features with economic meaning
- Design a clear label (e.g., whether future 4-hour return >0)
- Time series validation + rolling test
- Gradually add on-chain and text factors
This approach keeps problem localization clear, iteration costs low, and deployment path short.
Complex systems aren’t built all at once—they expand layer by layer from interpretable small systems.
Gate for AI’s Real Significance at the Data Layer
In actual implementation, the data stage is often the most time-consuming part: multi-source collection, format cleaning, time alignment, feature pipelines, strategy integration.
That’s why platform-based AI tools are increasingly important. Taking Gate for AI as an example of such infrastructure—the value isn’t in “generating a universal strategy for you,” but in helping traders efficiently complete the engineering loop from data to strategy and reducing friction between research and execution. Traders still need to define problems, set constraints, manage risks—but underlying workflows can be more standardized and reusable.
Lesson 1:Why Is AI Becoming the New Infrastructure for Crypto Trading?
Lesson 2:The Data Foundation for AI Trading—What Should You Feed Your Model?
Lesson 3:From Analysis to Prediction: How Does AI Generate Tradable Signals?
Lesson 4:Strategy Automation: From Backtesting to Live Trading
Lesson 5:Risk Management in AI Trading—Models Fail, Systems Must Remain Controllable
Lesson 6:From AI Assistance to Human-Machine Collaboration: The Long-Term Evolution Path of Crypto Trading Systems
Related Courses

The Beginner's Guide to Blockchain-based Airdrops

Crypto Mining Equipment

Identity in Crypto: Main Projects

Introduction to Masternode Tokens

Learn about web3 data and analytics