XRP Price Prediction: Consolidation Near 1.7 - 1.9 USD and the 100 Dollar Scenario
Preface
In the 2025 crypto market, XRP’s price movement represents a consolidation phase with clear structural significance, not just a period of sideways trading. Earlier in 2025, XRP posted a strong rally, setting a new all-time high. The market then shifted into a prolonged correction and consolidation, with price volatility gradually unwinding excess momentum.
Market observers have noted that XRP’s current price structure is increasingly mirroring the market pattern seen before its breakout in 2016–2017. Technically, this isn’t a short-term sentiment fluctuation, but a process where time is exchanged for space as momentum builds.
Nearly 400 Days of Lateral Accumulation: A Test of Market Patience
Chart analysis shows XRP has undergone roughly 393 days of range-bound consolidation, almost matching the 395-day consolidation phase before the 2016–2017 bull run. During that period, XRP’s price repeatedly fluctuated within a narrow band, with buyers and sellers locked in a prolonged standoff and no clear directional trend.
Extended sideways consolidation typically signals a redistribution of market positions. Bullish and bearish forces reach temporary equilibrium, leaving the price without immediate momentum to break out or drop sharply. Yet, these phases often quietly set the stage for trend reversals.
From Consolidation to Downward Channel: Is History Repeating?
In the 2016–2017 cycle, XRP didn’t rally immediately after its consolidation. Instead, it entered a “downward channel” structure, with prices gradually declining and volatility compressing until a sharp breakout occurred as market interest waned.
In the 2024–2025 cycle, XRP is showing a similar pattern. After falling from its $3.40 peak, the price has formed a downward channel, now fluctuating in the $1.70–$1.90 range. Structurally, this area closely matches the relative position before the 2017 breakout, though the price scale is much larger.
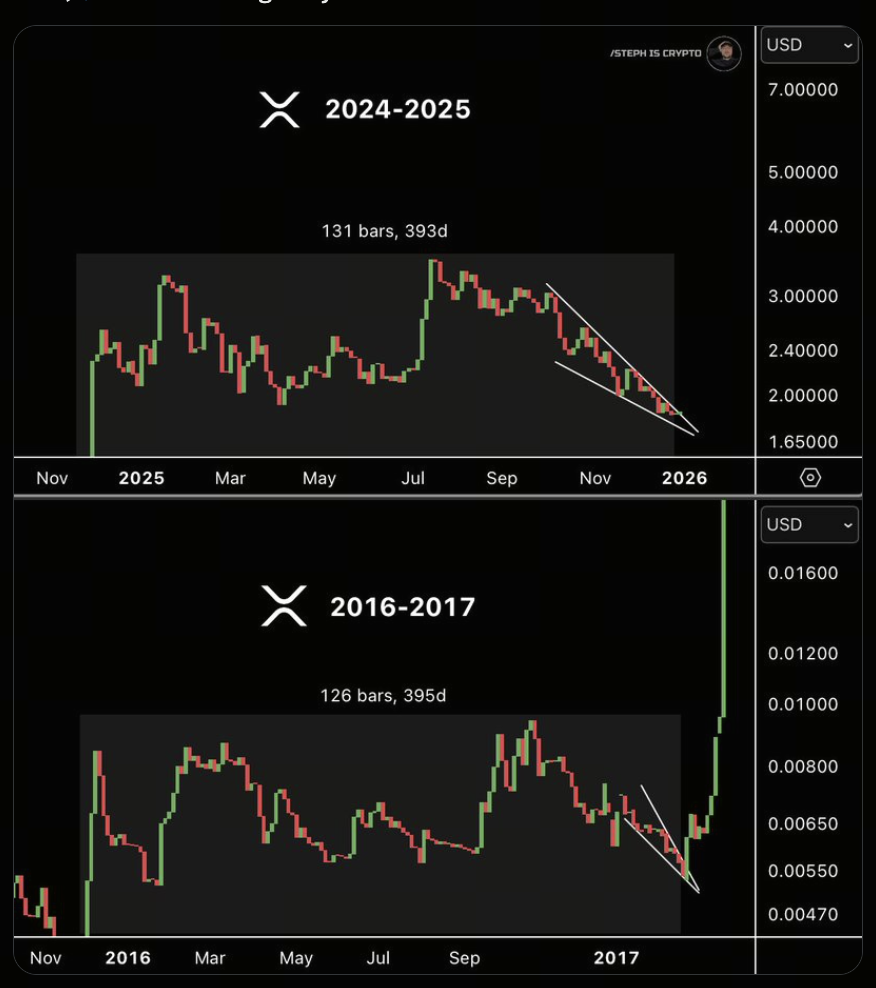
(Source: Steph_iscrypto)
If History Repeats, How Much Upside Is Possible?
In 2017, after breaking out of the downward channel, XRP quickly reclaimed several key price levels and surged to about $0.40—a gain of over 5,000%, marking the first major rally in XRP history.
Applying a mathematical approach to match the historical percentage increase, if XRP were to post a similar move from the current $1.70–$1.90 range, the theoretical target would be near $100. This is not a short-term forecast but a long-term scenario based on historical structural symmetry.
Low Market Attention Is Often a Precursor to Trend Reversal
Notably, both in 2017 and now, XRP saw low levels of market discussion and attention during the latter part of its downward channel. Prices hadn’t shown dramatic swings, and sentiment remained subdued, yet these conditions often offer the greatest potential for major trend shifts.
Start trading XRP spot now: https://www.gate.com/trade/XRP_USDT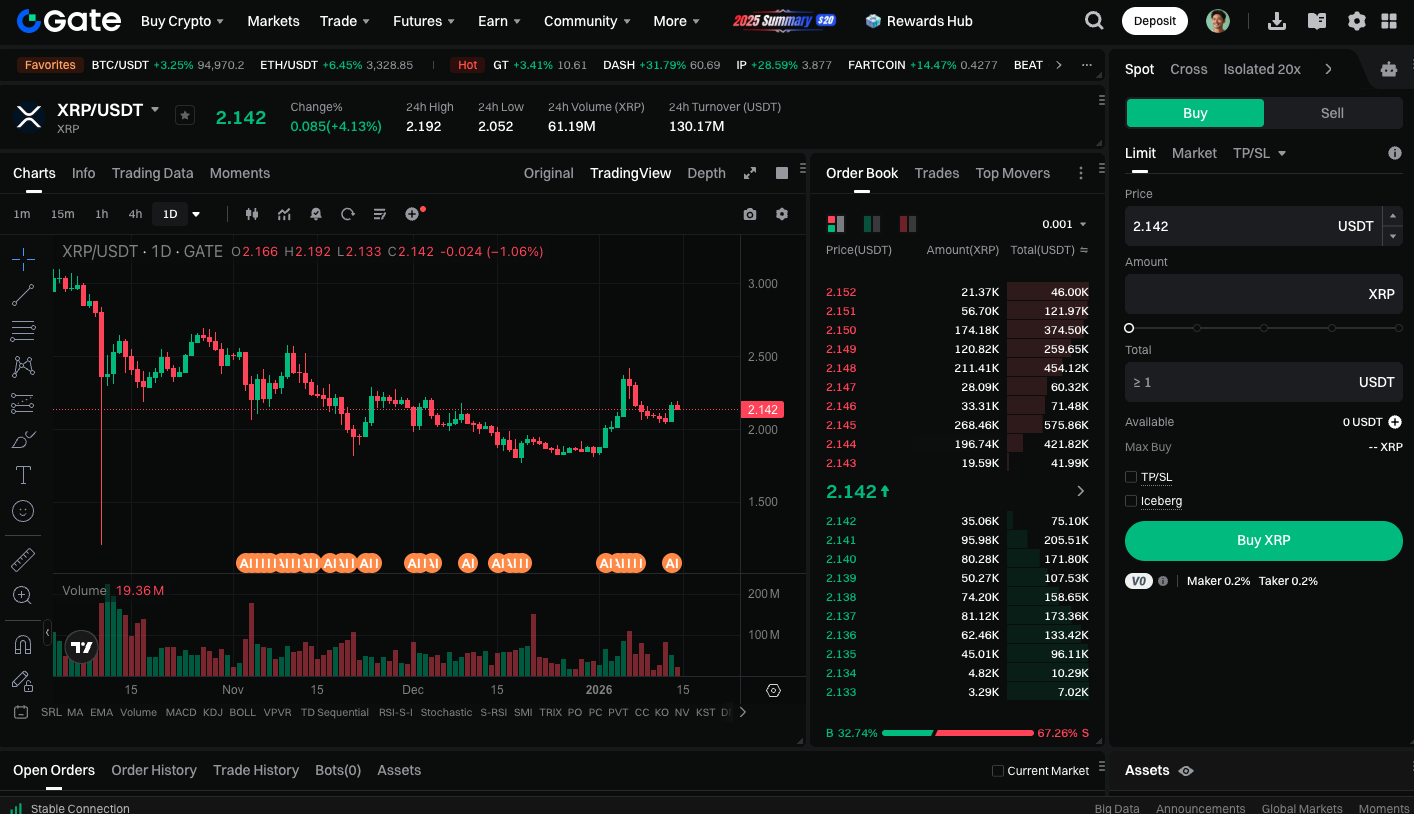
Conclusion
XRP’s current price action resembles a prolonged structural consolidation rather than simple weakness. The nearly 400 days of consolidation, followed by the downward channel, closely echo the pre-bull run pattern of 2016–2017. While short-term prices remain constrained in the $1.70–$1.90 range, historical precedent and structural analysis suggest these compression phases often precede major market moves. For long-term investors, whether XRP can repeat history will depend on market confidence, capital flows, and the broader crypto environment moving in sync.
Related Articles

AI-Native Settlement Layers: How United Stables Is Building the Next Financial Rail

The ve(3,3) Flywheel Explained: How AERO Tokenomics Powers Aerodrome’s DeFi Economy

How Does PAXG Work? In-Depth Overview of the Physical Gold Tokenization Mechanism

Aerodrome Tokenomics: How ve(3,3) Powers Base's Most Profitable DEX

How is the price of PAXG determined? Pegging mechanism, trading depth, and influencing factors
