XLE vs XOP: How Do Their Holdings Structure and Industry Allocation Compare?
Both XLE and XOP are U.S. energy sector ETFs, but their core investment approaches differ fundamentally. XLE leans more toward large, general energy companies, while XOP prioritizes broad coverage across the energy industry. As a result, the two ETFs exhibit notable differences in portfolio composition, volatility characteristics, and how they respond to energy market cycles.For anyone following the energy market, understanding the difference between XLE and XOP provides more than just insight into how energy ETFs are built—it also sheds light on the distinct market dynamics among companies across the U.S. energy supply chain.
Where XLE and XOP Stand
Although both XLE and XOP are U.S. energy ETFs, they track different segments of the market.
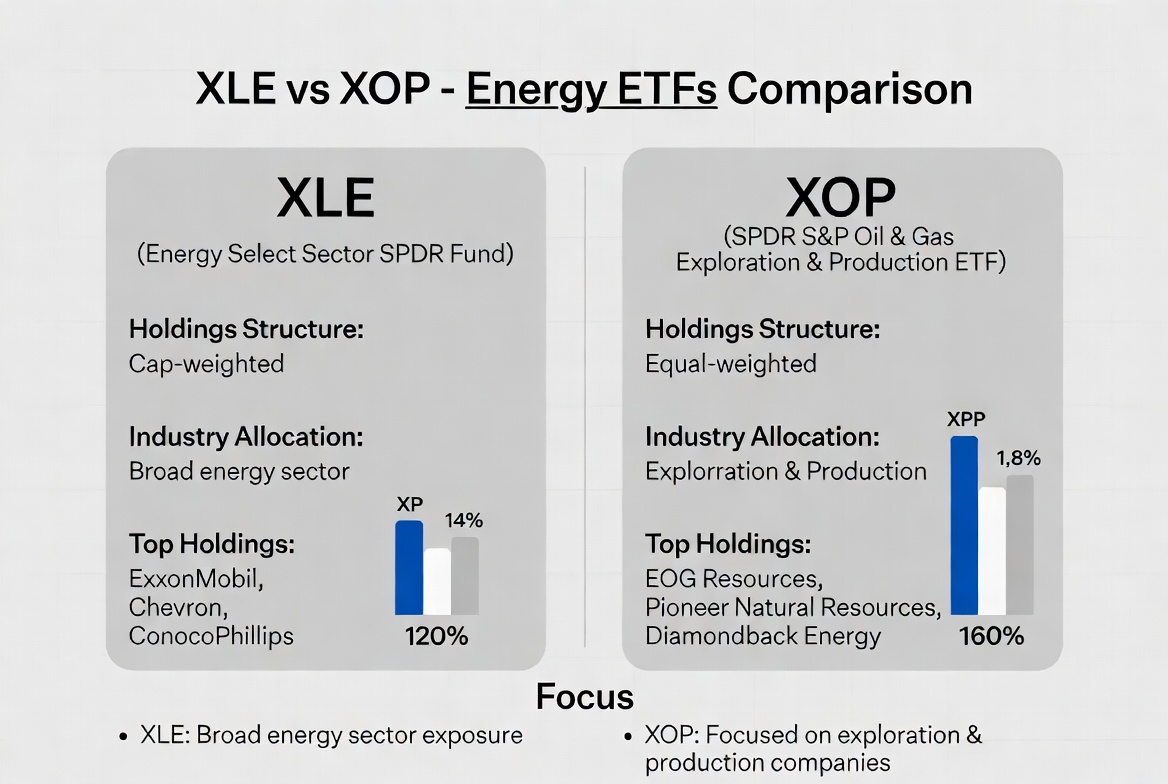
XLE focuses on the overall performance of the broader U.S. energy sector. Its holdings span oil production, natural gas operations, refining, and integrated energy conglomerates, offering a snapshot of how large U.S. energy companies are faring. For many market participants, XLE serves as a key gauge for the traditional U.S. energy space.
XOP, by contrast, has a tighter scope. It mainly targets oil and gas exploration and production companies, capturing the market performance of upstream resource firms in the energy supply chain. Because these companies' revenues are more closely tied to crude oil and natural gas prices, XOP tends to reflect the impact of energy commodity price cycles more directly.
In terms of market positioning, XLE is more of a "U.S. energy industry ETF," while XOP is more of a "U.S. oil and gas extraction ETF."
This distinction means that even though both ETFs sit in the energy sector, they represent market logic at different levels of the supply chain. XLE emphasizes the comprehensive operating capability of large energy enterprises, whereas XOP focuses on how oil and gas price fluctuations affect upstream profitability.
Differences in Holdings Structure
The biggest difference between XLE and XOP lies in their weight allocation. XLE follows a leader-dominated model, giving heavy weight to large integrated energy companies. As a result, a handful of giants can significantly sway the ETF’s performance.
XOP, on the other hand, takes a more equal-weight approach. It spreads its allocation across more oil and gas exploration and production companies, reducing any single company’s impact. Here’s how they compare:
| Comparison Dimension | XLE | XOP |
|---|---|---|
| Core Focus | Integrated energy giants | Oil and gas exploration firms |
| Weighting Style | Concentrated on leaders | Relatively balanced |
| Industry Coverage | Full energy value chain | Upstream oil and gas extraction |
| Company Size | Dominantly large-cap | Mix of mid- and large-cap |
| Volatility Level | Relatively low | Relatively high |
This structural difference means the two ETFs can perform very differently even in the same market environment.
Differences in Industry Allocation
XLE takes a broader view of the energy ecosystem. Beyond oil extraction, its holdings typically include natural gas production, refining, transportation, marketing, and international energy trading. As a result, XLE captures performance across multiple links in the energy supply chain.
XOP’s industry focus is narrower. Its main holdings are concentrated in oil and gas exploration and production companies, tilting its allocation heavily toward the upstream part of the value chain. Changes in oil and gas prices can therefore have a more direct impact on the profitability of these firms.
From a supply chain perspective, XLE is closer to being an "energy industry ETF," while XOP is more like an "oil and gas extraction ETF."
Differences in Risk-Return Profiles
Risk-return characteristics are one of the clearest contrasts. XLE holds numerous large energy firms that typically boast stable balance sheets, mature business models, and strong cash flow—so overall volatility is lower.
XOP’s oil and gas extraction holdings are far more dependent on commodity prices. When oil prices rise, their profitability can surge; when prices fall, their earnings can take a swift hit.
This makes XOP more volatile and more sensitive to cyclical swings.
Historically, through energy market cycles, XOP has shown larger upside and deeper drawdowns compared to XLE.
Differences in Sensitivity to Energy Cycles
The energy cycle is a key driver for both ETFs. When global crude oil prices enter an uptrend, upstream oil and gas companies are usually the first to benefit. Since XOP is primarily composed of such companies, it is generally more sensitive to oil price moves.
XLE also benefits from rising energy prices, but large integrated companies have more diversified revenue streams, so the effect of price increases is more muted.
During energy market booms, XOP’s percentage gains tend to outpace XLE's.
In downturns, XLE’s large-cap holdings, with their stronger risk resilience, typically offer better stability.
In short, the two ETFs represent different ways to play the energy cycle.
Application Scenarios Under Different Market Conditions
XLE and XOP play different roles depending on the market environment. When investors are focused on long-term allocation to energy, XLE tends to draw more attention. Its large, established companies with global reach make it a solid proxy for the U.S. energy sector.
When the spotlight is on rising oil prices, energy shortages, or resource cycles, XOP’s profile rises. Because its holdings are more sensitive to oil and gas prices, it more quickly reflects the market impact of energy cycle shifts.
In recent years, amid growing energy security concerns and heightened market volatility, some TradFi CFD products have started covering energy ETFs. In addition to trading through traditional brokerage accounts, some users also track XLE or XOP price movements via CFD products that offer exposure to energy asset prices.
Summary
XLE and XOP are both U.S. energy ETFs, but they embody different energy investment philosophies. XLE focuses on large integrated energy companies, emphasizing industry representation and stability. XOP focuses on oil and gas exploration and production firms, highlighting resource cycles and commodity price sensitivity.
At its core, XLE represents the ecosystem of U.S. energy giants, while XOP represents the U.S. oil and gas production industry itself. Understanding their differences provides a fuller picture of the industry structure and cycle dynamics in the energy market.
FAQ
What’s the biggest difference between XLE and XOP?
XLE mainly holds large integrated energy companies, while XOP mainly holds oil and gas exploration and production firms. This leads to significant differences in industry coverage and risk profiles.
Why is XOP usually more volatile than XLE?
XOP’s holdings generate revenue that is more directly tied to crude oil and natural gas prices, making them more sensitive to energy cycle shifts and leading to greater market volatility.
Does XLE only invest in oil companies?
No. XLE covers oil, natural gas, refining, energy transportation, and integrated energy firms, reflecting key segments across the entire energy value chain.
Is XOP more closely correlated with oil prices?
Generally, yes. Because XOP focuses on oil and gas exploration and production companies, changes in oil prices have a more direct impact on their profitability.
Which ETF better represents the U.S. energy industry, XLE or XOP?
XLE is generally a better gauge of the overall U.S. energy industry because of its broader coverage and inclusion of large integrated energy companies.
How can I trade XLE and XOP?
XLE and XOP can be traded through brokerage accounts that support U.S. stocks. Some platforms also offer TradFi CFD products linked to energy ETFs for tracking price movements in the energy sector.
Related Articles

How Does PAXG Work? In-Depth Overview of the Physical Gold Tokenization Mechanism

How is the price of PAXG determined? Pegging mechanism, trading depth, and influencing factors

Gate Research: 2024 Cryptocurrency Market Review and 2025 Trend Forecast

Altseason 2025: Narrative Rotation and Capital Restructuring in an Atypical Bull Market

The Impact of Token Unlocking on Prices