What Is Awesome Oscillator (AO)?
The Awesome Oscillator (AO) is a momentum indicator that shows whether short-term market momentum is stronger or weaker than longer-term momentum. As crypto and other fast-moving markets have become more widely traded, AO has gained attention as a simple way to visualize shifts in buying and selling pressure. Understanding how it works helps traders interpret whether momentum is building, fading, or starting to change direction.Crypto markets are known for fast sentiment shifts, sudden breakouts, and equally sharp reversals, which makes momentum analysis an important part of chart reading. Prices can move strongly in one direction for a short period, then stall, retrace, or reverse as buying and selling pressure changes. In that environment, traders often use tools that help show whether a move is still gaining strength or starting to lose force.
Technical indicators like Awesome Oscillator (AO) fit that role by acting as a momentum oscillator based on the difference between a short-term and a long-term moving average of median price. Instead of focusing only on price direction, it helps traders judge whether momentum in the crypto market is strengthening, weakening, or beginning to shift. Its histogram format makes those changes easier to read on a chart, especially for traders who want a clearer visual view of market pressure without relying on multiple overlapping lines.
For beginners, that visual simplicity can make a real difference. Even so, AO is most useful when it is read alongside broader chart context, including trend direction, support and resistance, and other confirmation tools.
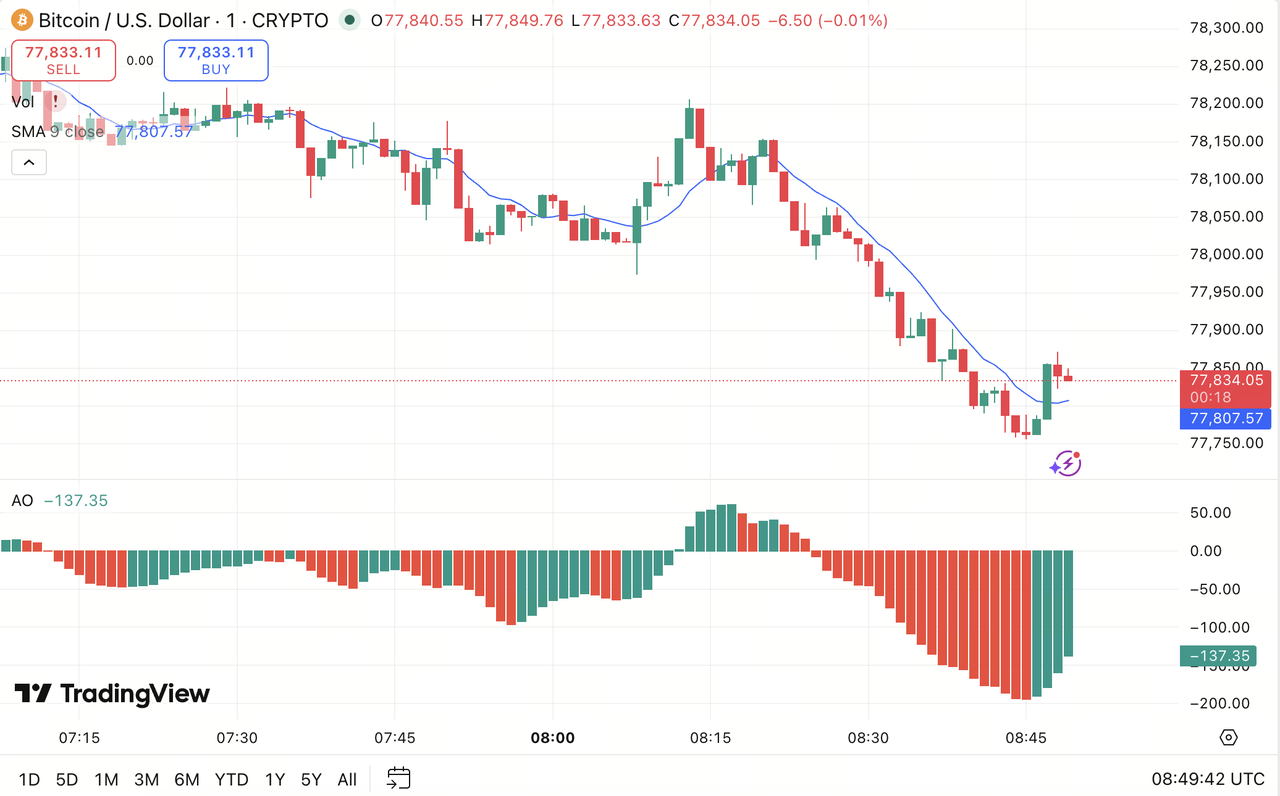
Source: TradingView
What the Awesome Oscillator Is
In chart analysis, the Awesome Oscillator compares short-term momentum with longer-term momentum through a histogram built from median price. For traders, its main value lies in showing whether market strength is increasing, fading, or beginning to turn.
AO belongs to the broader category of momentum indicators. These tools do not focus mainly on where price is, but on how strongly price is moving. That distinction matters because a market can still be rising while momentum is already slowing, or falling while selling pressure is starting to ease.
The indicator is based on the difference between a faster moving average and a slower moving average of median price. Median price is usually taken from the midpoint between a candle’s high and low. Because of that, AO does not rely only on closing prices. It uses a broader view of each candle’s trading range.
For a beginner, the practical interpretation is straightforward:
-
When AO is above zero, short-term momentum is stronger than longer-term momentum.
-
When AO is below zero, short-term momentum is weaker than longer-term momentum.
-
When the histogram bars begin to grow or shrink, momentum may strengthen or fade.
AO does not predict price with certainty. Its role is to make momentum easier to read on the chart.
How AO Measures Momentum Shifts
AO measures momentum shifts by tracking the gap between a shorter moving average and a longer moving average. When the short-term average pulls farther above the long-term average, the histogram rises. When that gap narrows or turns negative, the histogram falls.
This matters because momentum usually changes before trends become fully visible. A trend may still appear healthy on the chart while the underlying momentum is already weakening. AO helps traders notice those transitions earlier.
A practical way to think about AO is through three common behaviors:
-
Rising bars above zero: bullish momentum is strengthening.
-
Falling bars below zero: bearish momentum is strengthening.
-
Bars moving back toward zero: the current move may be losing force.
That does not mean every shift points to a reversal. Sometimes the market simply pauses, consolidates, and then continues in the same direction. This is why AO is best used as a context tool rather than as an isolated trigger.
For example, imagine a crypto asset in a steady uptrend. If AO remains above zero but the bars begin to shrink, the message may be that bullish momentum is cooling rather than collapsing. If the bars continue weakening and then cross below zero while price also loses structure, traders may begin to read that as a more meaningful change in momentum.
AO is useful because it turns that change in market pressure into something visual and easier to compare from one candle to the next.
Reading AO Histogram Signals
The histogram is the most important part of the Awesome Oscillator. Each bar gives a visual read on whether momentum is improving or weakening relative to recent price behavior.
For beginners, the clearest approach is to focus on three things: the zero line, the size of the bars, and the sequence of the bars over time.
-
Zero Line Position
The zero line acts as a dividing point between bullish and bearish momentum.
-
Above zero: momentum is generally tilted to the upside.
-
Below zero: momentum is generally tilted to the downside.
A move through the zero line can suggest that momentum is shifting. Still, zero-line crosses should not be treated as automatic trade signals. In sideways markets, the histogram can move above and below zero repeatedly without producing a clean trend.
-
Bar Size
The size of the bars shows whether momentum is expanding or contracting.
-
Taller positive bars often suggest growing bullish momentum.
-
Deeper negative bars often suggest growing bearish momentum.
-
Smaller bars can indicate that the current move is losing strength.
This does not always lead to a reversal, but it does show that momentum is changing.
-
Bar Sequence
A single bar rarely tells the full story. What matters more is how several bars develop together.
A series of rising bars above zero often reflects building upside momentum. A series of deeper bars below zero can reflect strengthening downside pressure. By contrast, bars that keep shrinking may suggest that the current trend is running out of energy.
The table below summarizes common AO readings in practical chart analysis:
| AO Histogram Condition | Basic Interpretation | What Traders Commonly Check Next |
|---|---|---|
| Bars above zero | Bullish momentum is stronger than the longer-term average | Trend direction, resistance, volume |
| Bars below zero | Bearish momentum is stronger than the longer-term average | Support levels, broader weakness |
| Bars rising toward zero from below | Downside pressure may be easing | Reversal structure, breakout confirmation |
| Bars falling toward zero from above | Upside pressure may be fading | Pullback behavior, support holding |
| Frequent flips around zero | Market may be choppy or range-bound | Price structure, trend quality |
Some traders also watch for more advanced AO patterns, such as twin peaks or saucer formations. For beginners, however, the most useful starting point is still the simplest one: where the bars are, how large they are, and whether they are becoming stronger or weaker.
AO vs MACD: Momentum Comparison
AO and MACD are both used to study momentum, but they present information in different ways. They often aim to answer similar questions, yet they do so with different chart structures.
The most obvious difference is in presentation. AO is usually shown as a standalone histogram centered around a zero line. MACD, by contrast, typically includes a MACD line, a signal line, and a histogram. That gives MACD a more layered structure, while AO remains visually cleaner.
For beginners, AO often feels easier to scan because it strips momentum down to a single visual element. MACD can offer more detail, but that also means it may take longer to learn and interpret comfortably.
A simple comparison looks like this:
-
AO: focuses on momentum through a clean histogram view.
-
MACD: combines line crossovers and histogram behavior for a broader signal structure.
-
AO: often feels faster and more visual.
-
MACD: often provides more confirmation, but with added complexity.
In crypto trading, some traders prefer AO when they want a quick read on whether momentum is expanding or fading. Others rely on MACD because they value the extra confirmation that line interactions can provide.
Neither tool is universally better. In practice, the better choice depends on trading style, timeframe, and how much confirmation a trader wants before making a decision. Some traders even use both, looking for agreement between them before taking momentum signals seriously.
When AO Performs Best
AO tends to work best when the market is trending clearly. In a strong uptrend or downtrend, momentum usually develops in a cleaner way, which makes the histogram easier to interpret. Under those conditions, AO can help traders judge whether the trend still has strength or whether it is beginning to weaken.
This is one reason AO can be useful in crypto during strong directional moves, breakouts, or extended trend phases. When price moves with conviction, the histogram often reflects that momentum in a way that is easy to spot.
AO is commonly most effective when:
-
the market is already trending upward or downward
-
momentum is expanding after a breakout
-
traders want to confirm that a pullback may be slowing
-
it is combined with tools like moving averages, support and resistance, or price structure analysis
The indicator is usually less reliable in sideways markets. When price chops back and forth inside a range, momentum can shift rapidly without follow-through. In those periods, AO may cross the zero line too often and produce signals that look meaningful but lead nowhere.
That is why many traders first ask a broader question before using AO: is the market actually moving with direction, or is it just fluctuating without a trend?
Limitations of AO
The Awesome Oscillator is useful, but it has clear limitations.
First, it is still a lagging indicator. Because it is built from moving averages, it reacts to price behavior rather than forecasting it. By the time the histogram clearly changes, part of the move may already be underway.
Second, AO can become noisy in low-direction environments. Crypto markets do not always trend cleanly. During range-bound periods, the histogram may flip between positive and negative readings without producing a strong move either way. That can lead to confusion, especially for beginners who expect every signal to result in follow-through.
Third, AO does not provide enough context by itself. It does not identify major support and resistance levels, market structure breaks, false breakouts, or external factors that may affect price. A strong reading on AO is not the same as a complete trade setup.
Finally, it can be misused when traders treat it as a standalone system. AO is generally more effective as a confirmation tool than as a single-source signal generator. It works better when it supports what the broader chart is already showing.
Conclusion
The Awesome Oscillator (AO) is a momentum indicator that helps traders compare short-term market force with longer-term momentum through a simple histogram. Its main purpose is to show whether momentum is strengthening, weakening, or beginning to shift.
For beginners, its value lies in clarity. Bars above zero suggest stronger bullish momentum, while bars below zero suggest stronger bearish momentum. Changes in bar size and bar sequence can help show whether that momentum is building or fading.
AO is most useful in trending conditions, where momentum shifts are easier to interpret and more likely to matter. In sideways markets, its signals can become noisy and less reliable. For that reason, it is best used with other tools rather than on its own.
A practical way to understand AO is to see it as a chart-reading aid. It does not replace trend analysis or confirmation, but it can make momentum easier to recognize and easier to evaluate in real market conditions.
FAQs
Is the Awesome Oscillator suitable for beginners?
Yes. It is often considered beginner-friendly because the histogram format is easier to read than some more complex indicators. The main skill is learning to place its signals in the context of the broader chart.
What does it mean when AO is above zero?
It usually means short-term momentum is stronger than longer-term momentum. Traders often interpret this as a sign of bullish momentum.
What does it mean when AO is below zero?
It usually means short-term momentum is weaker than longer-term momentum. That is commonly read as a bearish momentum condition.
Is AO better than MACD?
Not necessarily. AO is simpler and easier to scan, while MACD provides more layers of momentum confirmation. Which one feels more useful often depends on the trader’s style and preference.
Can AO be used by itself?
It is generally better not to rely on AO alone. It works more effectively when combined with trend analysis, price structure, support and resistance, volume, or other confirmation tools.
Does AO work well in crypto markets?
It can work well during strong directional moves, especially when momentum is clear. In sideways markets, however, AO may produce more noise and less reliable signals.
Related Articles

Exploring 8 Major DEX Aggregators: Engines Driving Efficiency and Liquidity in the Crypto Market

What Is Copy Trading And How To Use It?

What Is Technical Analysis?

How to Do Your Own Research (DYOR)?

What Is Fundamental Analysis?