MACD Indicator Explained: Bitcoin (BTC) Price Trends and Signals in 2026
What Is the MACD Technical Indicator?
The MACD (Moving Average Convergence Divergence) is a popular trend-following momentum indicator comprised of the MACD Line, Signal Line, and Histogram. It analyzes the relationship between different periods of Exponential Moving Averages (EMAs) to identify trend strength and potential reversal points.
Investors monitor MACD crossovers, histogram color changes, and activity near the zero axis to help determine whether a trend will continue or reverse.
Current Market Price and MACD Signal Overview
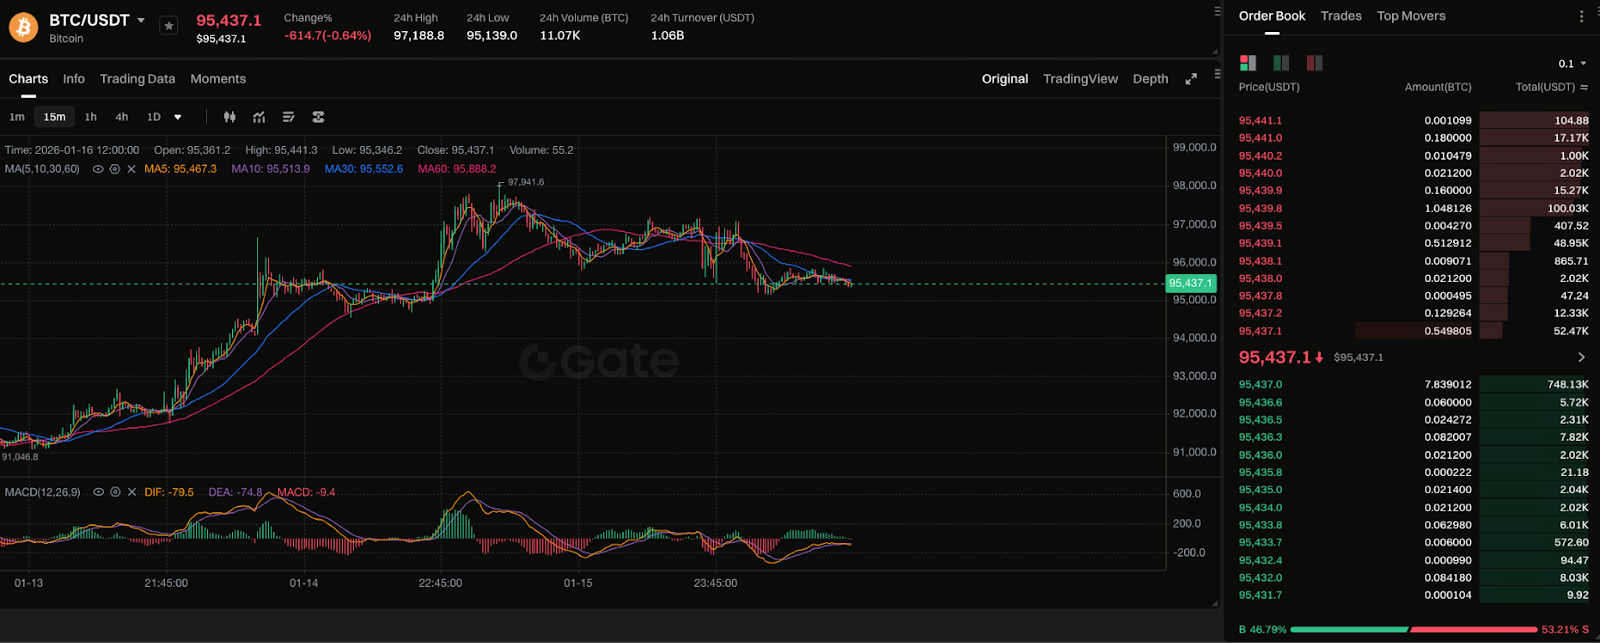
Chart: https://www.gate.com/trade/BTC_USDT
As of mid-January 2026, Bitcoin (BTC) has been trading in the $90,000–$95,000 range.
The BTC/USDT 15-minute chart shows that after reaching a high near $97,900, the price entered a consolidation phase and pulled back, now stabilizing around $95,500. Short-term moving averages (MA5, MA10, MA30) have converged repeatedly, signaling that the market has shifted into a low-volatility environment following rapid swings, with short-term bullish and bearish forces currently balanced.
Key MACD observations:
- DIF (yellow line) and DEA (purple line) remain below the zero axis, indicating short-term momentum is still weak.
- Recently, the MACD histogram has displayed a pattern of shrinking red bars → brief green bars → returning to shorter red bars, suggesting that bearish momentum is fading but bullish strength remains limited.
- DIF has attempted to cross above DEA several times but has not produced a valid golden crossover, reflecting insufficient short-term rebound momentum and weak bullish appetite in the current market.
- If DIF breaks above DEA again and the MACD histogram turns from red to green, it would confirm a short-term rebound; conversely, if DIF turns downward again, a new round of decline may follow.
Overall, BTC is currently in a low-volume consolidation phase with weak MACD signals and no clear directional trend. In this scenario:
- Bulls should wait for a MACD golden crossover and renewed divergence in moving averages to confirm a reversal.
- Bears may find opportunities if rebounds stall at MA30 or if the price drops below $95,000.
The overall signal suggests a weak consolidation range, with short-term direction hinging on shifts in momentum and trading volume.
How Does MACD Identify Trend Reversals?
Focus on three key MACD signals:
1. Bullish Crossover
When the MACD line crosses above the Signal Line from below, it typically signals a trend reversal or the start of upward momentum.
2. Bearish Crossover
When the MACD line crosses below the Signal Line, it may indicate a weakening trend or increasing downward pressure.
3. Histogram Pattern Changes
A histogram shift from red to green signals strengthening momentum; a change from green to red may suggest weakening bullish momentum.
Summary and Risk Warning
MACD is a proven and widely used technical indicator for trend analysis, but no single indicator is infallible. In highly volatile or directionless markets, MACD can generate delayed or false signals.
It’s best to use MACD alongside other indicators such as RSI, trading volume, and support/resistance levels to confirm trends. Do not rely solely on technical signals for trading decisions—robust risk management and capital allocation remain fundamental strategies for any investor.
Related Articles

AI-Native Settlement Layers: How United Stables Is Building the Next Financial Rail

The ve(3,3) Flywheel Explained: How AERO Tokenomics Powers Aerodrome’s DeFi Economy

How Does PAXG Work? In-Depth Overview of the Physical Gold Tokenization Mechanism

Aerodrome Tokenomics: How ve(3,3) Powers Base's Most Profitable DEX

How is the price of PAXG determined? Pegging mechanism, trading depth, and influencing factors
