How to Evaluate Crypto with DeFi Metrics
The filter exists. It’s called onchain fundamentals.
Those onchain fundamentals give DeFi a structural advantage over TradFi. One of several reasons why “DeFi will win”, but also essential to understand if you’re investing in the industry.
I’ve spent the last four years immersed in DeFi metrics, first as a researcher, then working at DefiLlama. This article is a summary of the most useful frameworks I’ve learned in that time to help you start using them.
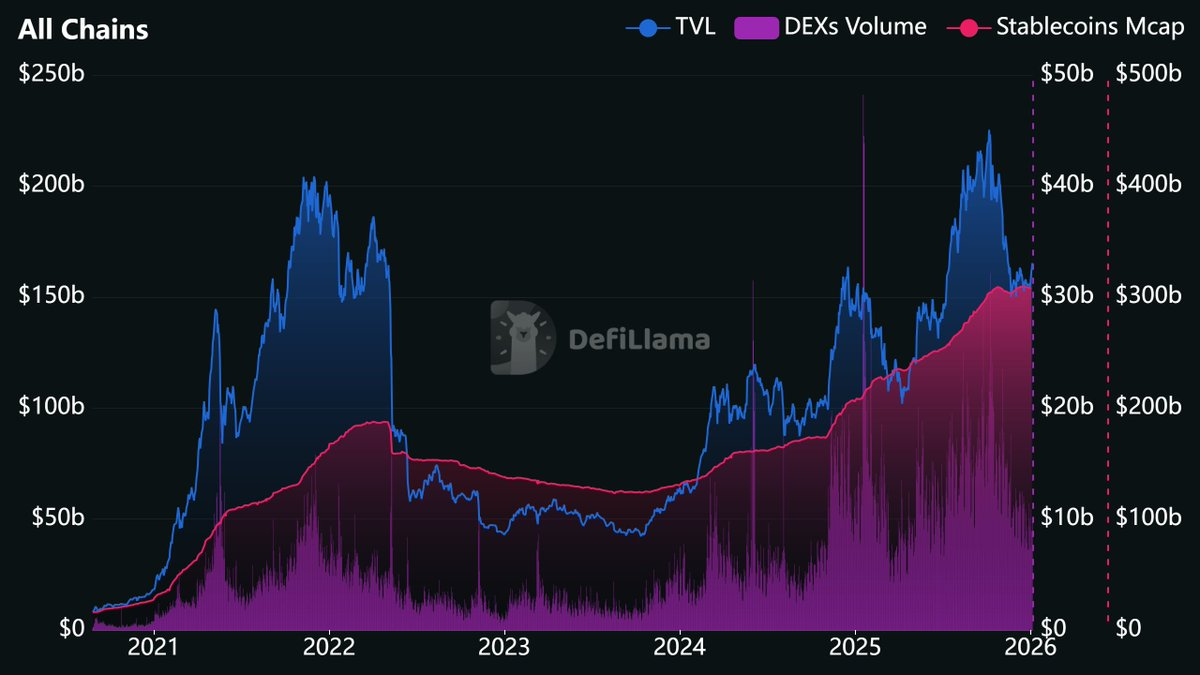
Source: https://defillama.com/?stablecoinsMcap=true&dexsVolume=true
Why DeFi Metrics Matter
Onchain metrics are a breakthrough not just in evaluating crypto, but in financial data more broadly.
Think about how traditional investors evaluate companies. They wait for quarterly earnings. Now, there’s talk of moving to biannual reports instead.
DeFi protocol financials are available in real time. Sites like DefiLlama publish them daily or hourly. If you wanted to track revenue by the minute, you could query the chain directly and do exactly that. (I’d question the utility of such granularity, but the option exists.)
This represents a genuine transparency breakthrough. When you buy stock in a public company, you’re trusting management’s reported numbers, filtered through accountants, delayed weeks or months. When you evaluate a DeFi protocol, you’re reading transactions directly from an immutable ledger as they occur.
Not every crypto project has fundamentals worth tracking. Memecoins, vapor projects with a whitepaper and a Telegram. Fundamentals won’t help you there (although other metrics like number of holders might provide some signal).
But protocols that generate fees, accumulate deposits, and distribute value to tokenholders? Those leave data trails which can be tracked long before narratives catch up.
Polymarket liquidity has been growing for years, long before prediction markets became a narrative.
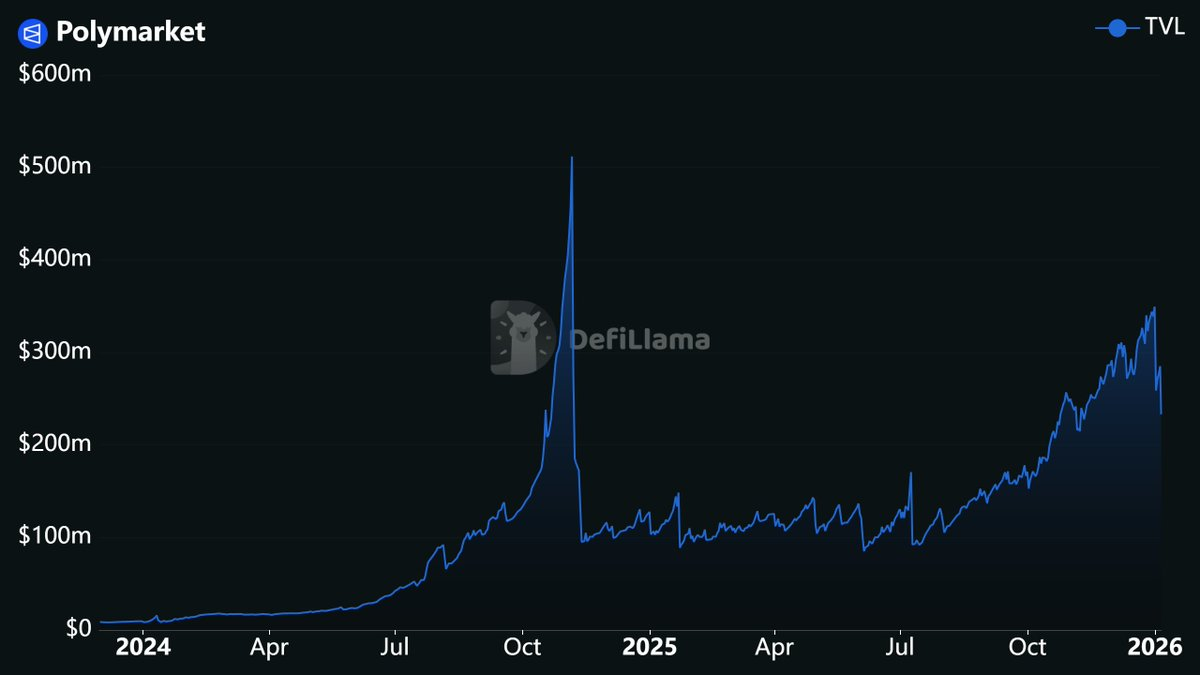
Source: https://defillama.com/protocol/polymarket
HYPE’s explosive price run last summer followed a sustained period of high revenue generation.
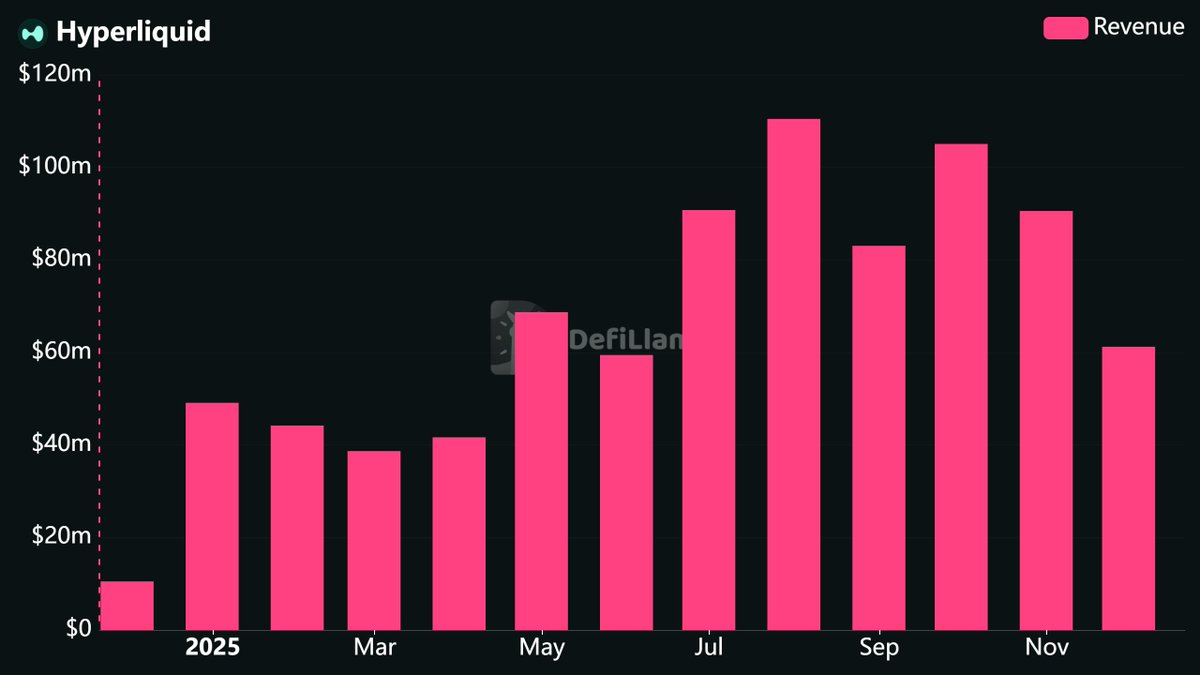
Source: https://defillama.com/protocol/hyperliquid?tvl=false&revenue=true&fees=false&groupBy=monthly
The metrics signaled what was coming. You just needed to know where to look.
The Core Metrics
To start, let’s go through the essential metrics to know when it comes to DeFi.
TVL (Total Value Locked)
TVL measures the total value of assets deposited into a protocol’s smart contracts. For a lending platform, this includes collateral and supplied assets. For a DEX, it’s liquidity pool deposits. For a chain, it’s the aggregate TVL of all protocols deployed on that network.
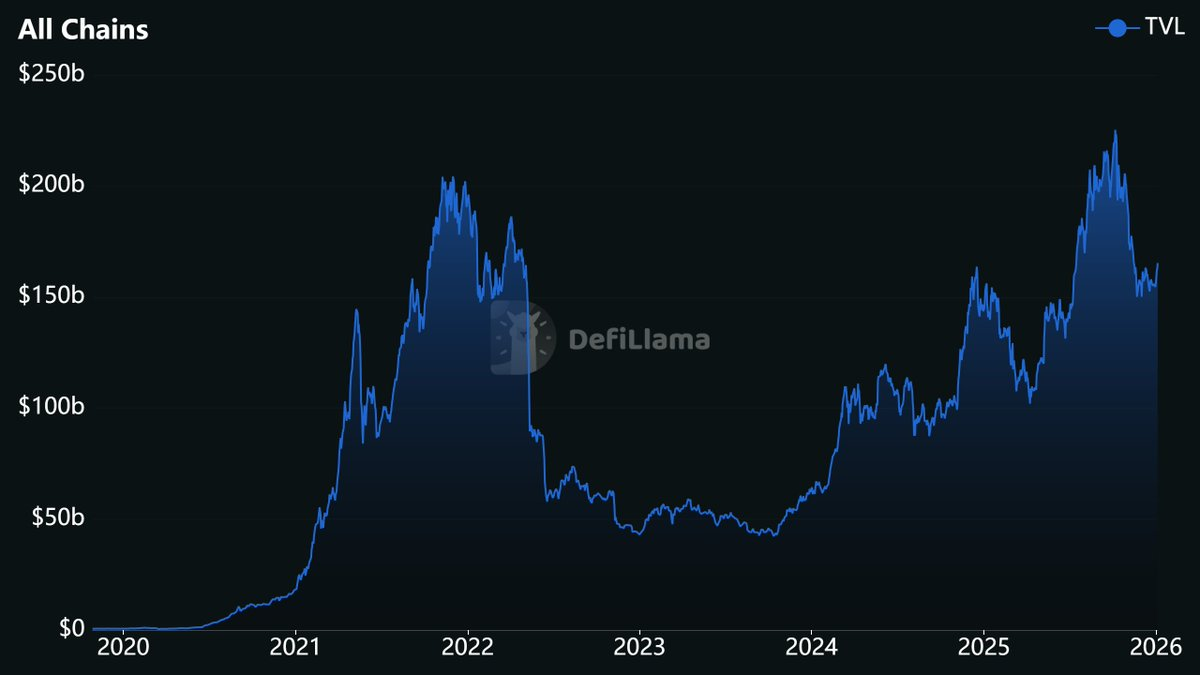
Source: https://defillama.com/
In TradFi terms, TVL is similar to Assets Under Management. A hedge fund reports AUM to show how much capital clients have entrusted to them. TVL serves an analogous purpose: it quantifies how much capital users have deposited into a protocol, signifying trust in the protocol’s smart contracts.
TVL as a metric has attracted criticism over the years, some of it deserved.
TVL doesn’t measure activity. A protocol can sit on billions in deposits while generating minimal fees. TVL also correlates heavily with token prices. If ETH drops 30%, every protocol holding ETH sees TVL decline proportionally, even if no actual withdrawals occurred.
Since most DeFi deposits are volatile tokens, TVL can be heavily impacted by price changes. Smart observers use USD Inflows alongside TVL to separate price movements from actual deposit activity. This metric calculates the balance difference for each asset between consecutive days, multiplied by price, then summed across all assets. A protocol with 100% ETH TVL that sees a 20% price drop would show a 20% TVL decline but $0 in USD Inflows.
TVL is still valuable when happening in both USD and token terms and when paired with a measure of activity or productivity. TVL also remains useful for gauging trust in a protocol and the overall size of DeFi. Just don’t mistake it for a complete picture.
Fees, Revenue, and Holders Revenue
This is where terminology gets confusing. DeFi uses these words differently than traditional accounting.
Fees represent the user perspective. What did you pay to use the protocol? When you swap on a DEX, you pay a fee. That fee might go entirely to liquidity providers, entirely to the protocol, or some split between them. Fees capture the total, regardless of destination. In TradFi terms, this resembles gross revenue.
Revenue captures the protocol’s cut. Of all the fees users paid, how much did the protocol actually keep for itself? This might flow to the treasury, the team, or tokenholders. Revenue excludes fees distributed to liquidity providers. Think of it as the protocol’s gross income.
Holders Revenue narrows further. This tracks only the portion of revenue that reaches tokenholders through buybacks, fee burns, or direct staking distributions. The closest TradFi analog would be dividends and share repurchases combined.
The distinction matters enormously for valuation. Some protocols generate massive fees but minimal revenue, since nearly everything goes to liquidity providers.
DefiLlama now publishes full income statements for many protocols. These statements update programmatically from onchain data, breakdown revenue to line items and reframe these metrics in standard accounting language.
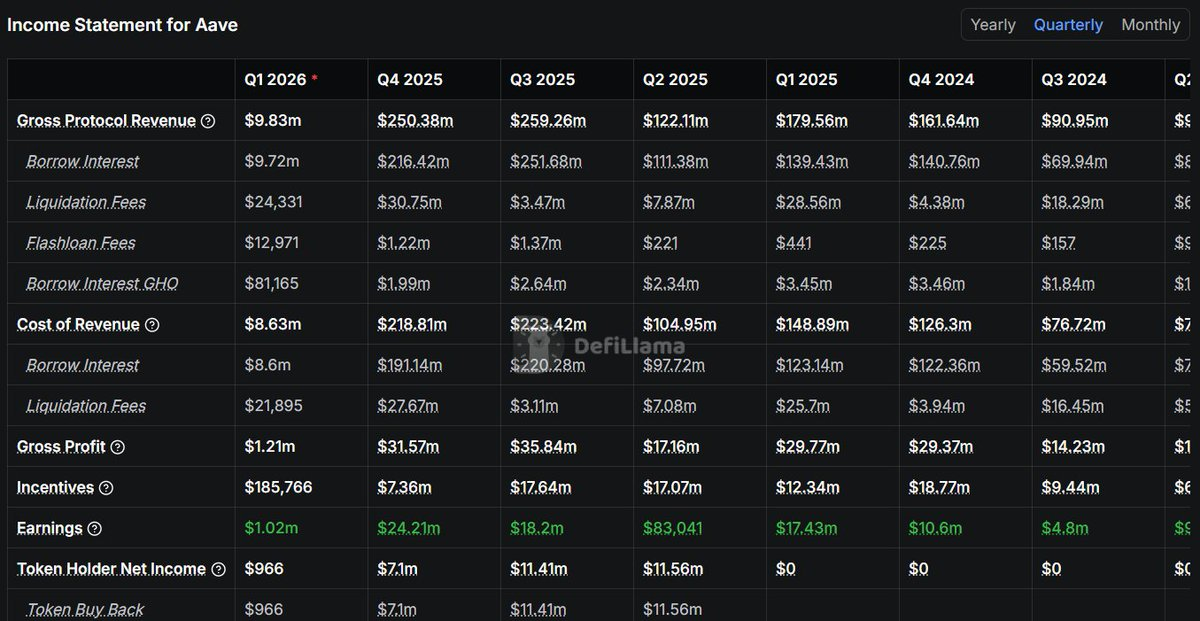
Source: https://defillama.com/protocol/aave
These statements are also accompanied by flow visualizations: from users, through the protocol, and out to various stakeholders. Worth exploring if you want to understand the economics of specific projects.
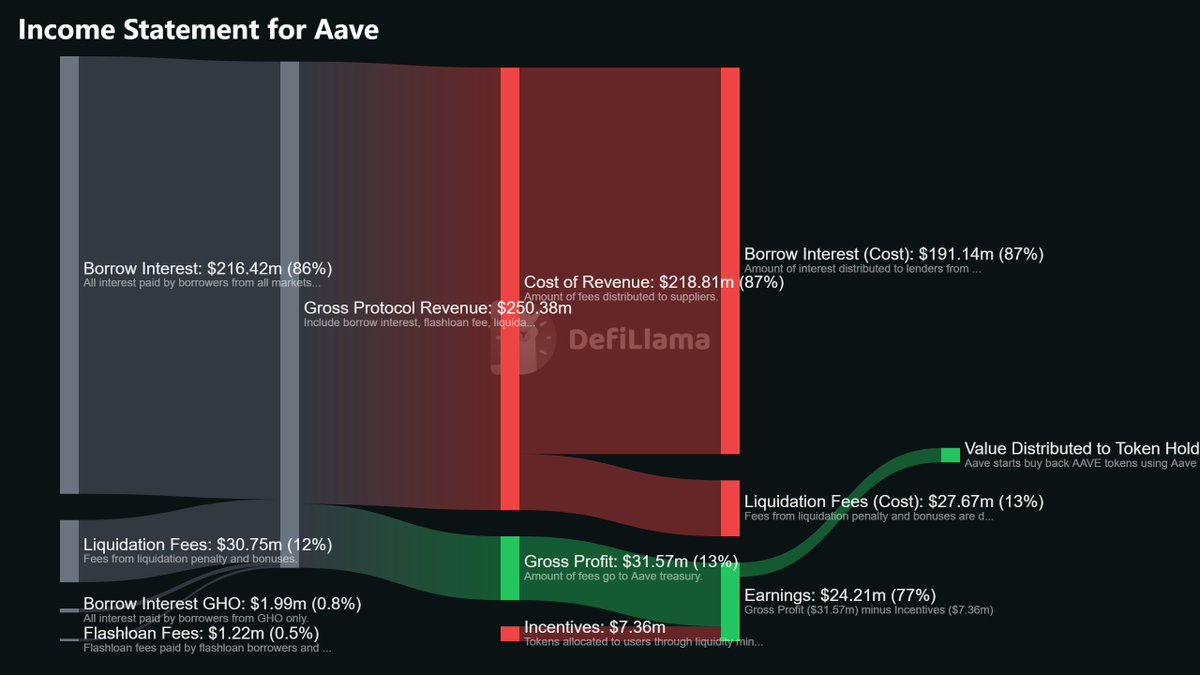
Source: https://defillama.com/protocol/aave
Volume
Volume tracks trading activity. DEX volume sums all swaps on decentralized exchanges. Perp volume sums all trades on perpetual futures platforms.
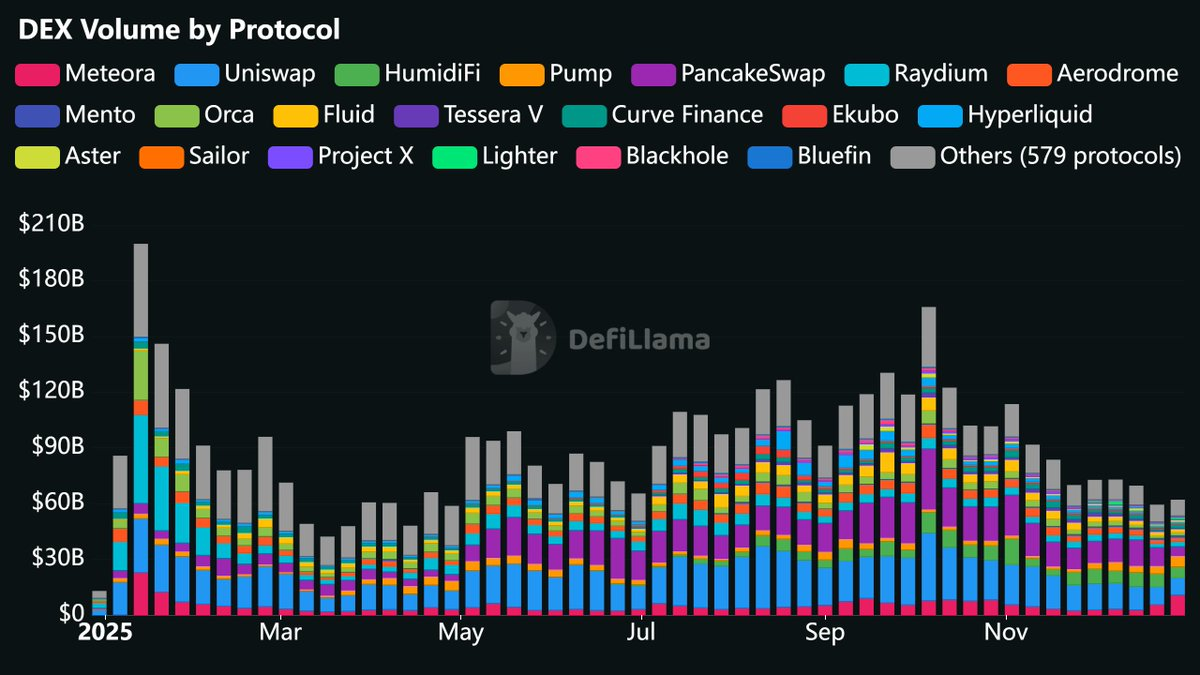
Source: https://defillama.com/pro/97i44ip1zko4f8h
The metric serves as a proxy for overall crypto engagement. When people actively use digital assets, they trade them. Volume spikes correlate with market interest, both during euphoric rallies and panic selloffs.
Perp volume has grown dramatically compared to previous cycles. In 2021, perpetual exchanges barely registered. Now platforms like Hyperliquid, Aster, and Lighter drive billions in daily volume. The sector’s growth rate makes historical comparisons less meaningful. Comparing current perp volume to 2021 tells you the sector expanded, not much else.
Within a category, market share trends matter more than absolute volume. A perp DEX growing from 5% to 15% market share is genuinely gaining ground, even if absolute volume is down. Many market share charts are available in DefiLlama’s custom dashboard library.
Open Interest
Open interest measures the total value of outstanding derivative contracts. For a perp DEX, it represents all positions that haven’t been closed or liquidated.
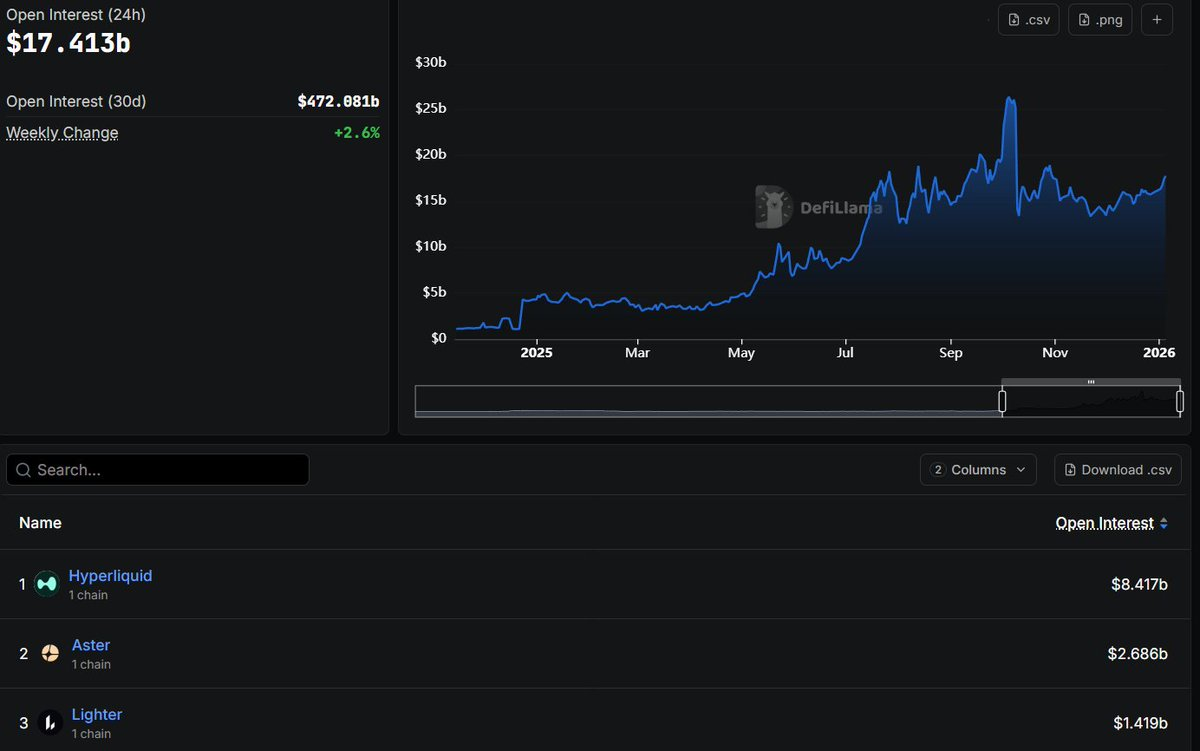
Source: https://defillama.com/open-interest
This functions as a liquidity metric for derivatives platforms. Open interest tells you how much capital is deployed in active perp positions.
The metric can collapse quickly during volatility. A major liquidation cascade wipes out open interest in hours. Tracking the recovery after such events reveals whether a platform can rebuild or whether the liquidity has permanently migrated elsewhere.
Stablecoin Market Cap
For chains, stablecoin market cap tracks the total value of all stablecoins deployed on that network.
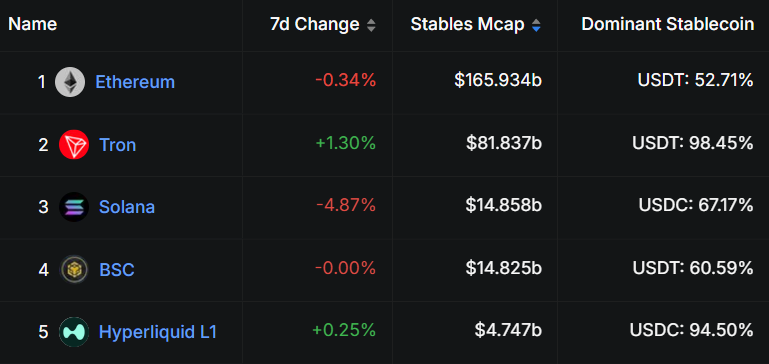
Source: https://defillama.com/stablecoins/chains
This metric serves as a capital inflows indicator. Unlike TVL, which fluctuates with token prices, stablecoins represent actual dollars (or dollar equivalents) that users have bridged onto a chain. When stablecoin market cap on a chain grows from $3 billion to $8 billion, that’s $5 billion in real capital that has entered the ecosystem.
Since October 2023, roughly $180 billion has entered crypto as stablecoins. Some portion of that inevitably finds its way into DeFi, driving TVL growth, trading volume, and fee generation. Stablecoin flows function like capital inflows to a country’s economy. Rising stablecoin supply signals new money entering; declining supply signals capital exit.
App Revenue & App Fees
App Revenue and App Fees are chain-level metrics. They sum up the revenue & fees generated by all applications deployed on that chain, excluding stablecoins, liquid staking protocols, and gas fees.
I think of this as the GDP of a blockchain. It tells you how much economic activity is actually happening in that ecosystem.
Revenue metrics are among the most difficult to fake, because they require users to actually spend money, making this a high signal activity metric for DeFi ecosystems.
Note that you cannot conduct valuations based on App Revenue as valuing an asset based on revenue it has no claim to doesn’t make sense. App Revenue and App Fees are for diagnosing whether a chain is growing, not for valuing it.
What To Actually Look For
Understanding individual metrics is step one. Applying them effectively requires a framework.
I like to apply a 3-part analysis:
- Prioritize consistent, steady growth
- Track both stock and flow metrics
- Account for unlocks and incentives
1) Prioritize Consistent, Steady Growth
Revenue charts that spike once and collapse tell you nothing about sustainable value creation. I’ve watched countless protocols post record weeks, only to fade to irrelevance within a month.
What matters is steady growth over extended timeframes. A protocol that grinds from $500K monthly revenue to $2M over six months demonstrates something durable. One that hits $5M once and drops to $300K was a momentary anomaly.
Time moves faster in crypto. A month of consistent growth here roughly equals a quarter in traditional markets. If a protocol shows six months of steady revenue expansion, treat it like a company with six quarters of improving earnings. That’s meaningful.
2) Track Both Stock and Flow Metrics
Stock metrics (TVL, open interest, stablecoin market cap, treasury) tell you how much is deposited. Flow metrics (fees, revenue, volume) tell you how much is happening.
You need both.
Activity is easier to fake. A protocol can subsidize volume through incentives or wash trading. Temporary spikes happen constantly. Liquidity is harder to manufacture. Getting users to actually deposit capital and leave it there requires genuine utility or attractive yields.
When evaluating any protocol, pick at least one stock metric and one flow metric. For a perp DEX, that might be open interest and volume. For a lending protocol, TVL and fees. For a chain, stablecoin market cap and app revenue.
If both categories show growth, the protocol is genuinely expanding. If only activity metrics grow while liquidity stagnates, dig deeper. Something may be artificial. If only liquidity grows while activity stagnates, deposits may be driven by only a few whales.
3) Account for Unlocks and Incentives
Token unlocks create sell pressure. Every week that a protocol releases vested tokens, some percentage gets sold. This selling needs to be offset by demand from elsewhere or price will drop.
Before investing, check the unlock schedule. A protocol with 90% of supply already circulating faces minimal future dilution. One with 20% circulating and a cliff unlock in three months faces a very different setup.
Similarly, high revenue looks less impressive when a protocol distributes more in token incentives than it receives back from users. DefiLlama tracks this through the Earnings metric, which subtracts incentive costs from revenue. A protocol might generate $10M in annual revenue but pay out $15M in token rewards.
While incentives are a valid growth strategy and often necessary early in a protocol’s lifecycle, they do generate sell pressure which must be offset.
Learning More
This overview covers the metrics you’ll encounter most frequently. The rabbit hole goes much deeper.
I published a full DefiLlama masterclass on YouTube that walks through the platform in detail: how to screen for undervalued protocols, evaluate chains, spot emerging projects, and avoid common analytical mistakes. Watch it here.
For ongoing guides on DeFi analysis, portfolio construction, and onchain research, I write regularly on my Substack at newsletter.dynamodefi.com.
The data exists. The only question is whether you’ll use it.
Disclaimer:
- This article is reprinted from [patfscott]. All copyrights belong to the original author [patfscott]. If there are objections to this reprint, please contact the Gate Learn team, and they will handle it promptly.
- Liability Disclaimer: The views and opinions expressed in this article are solely those of the author and do not constitute any investment advice.
- Translations of the article into other languages are done by the Gate Learn team. Unless mentioned, copying, distributing, or plagiarizing the translated articles is prohibited.
Related Articles

In-depth Explanation of Yala: Building a Modular DeFi Yield Aggregator with $YU Stablecoin as a Medium

Sui: How are users leveraging its speed, security, & scalability?

What Is a Yield Aggregator?

Dive into Hyperliquid

Aster vs Hyperliquid: Which Perp DEX Will Prevail?