Bitcoin in 2026 Shows a 2022 “Bear Market Rally” Pattern: Up 21% but Fails to Break Key Resistance
Current Bitcoin Market Review
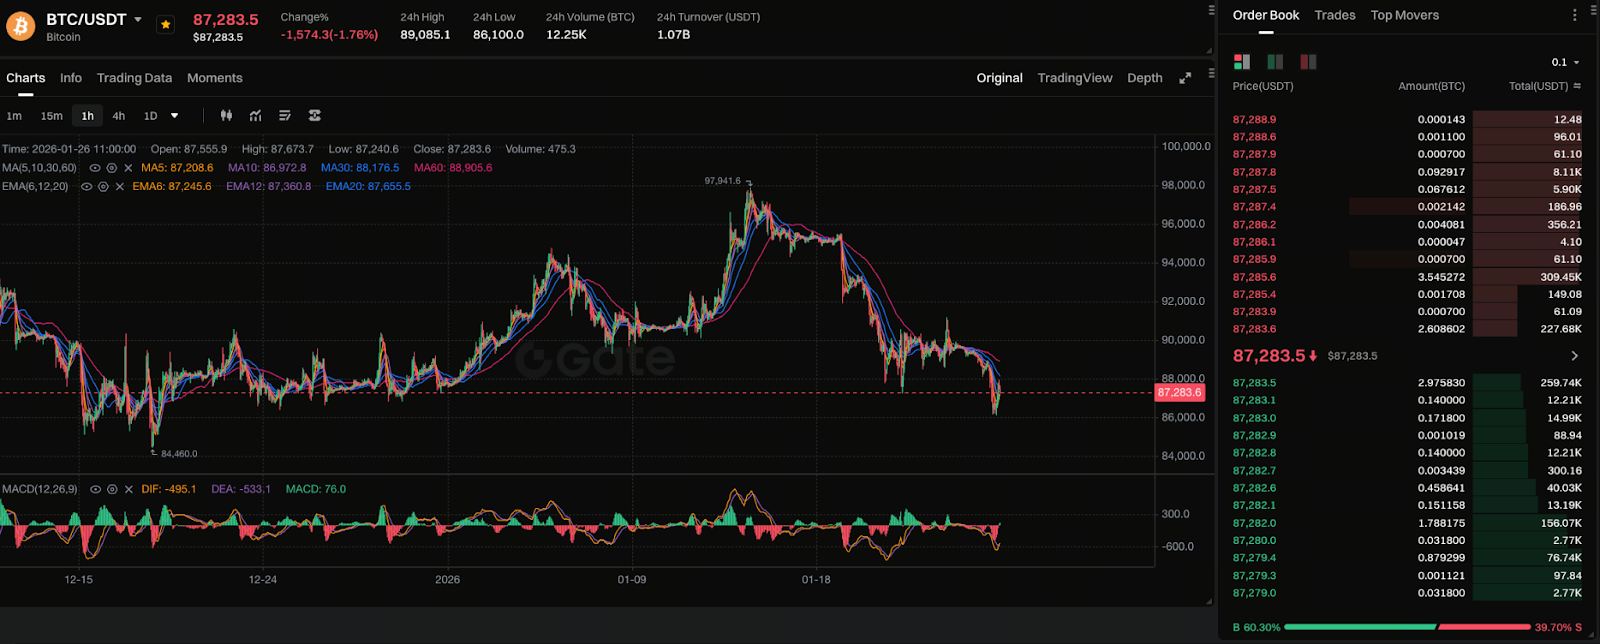
Chart: https://www.gate.com/trade/BTC_USDT
At the start of 2026, Bitcoin rebounded from its November 2025 low of around $80,500 to nearly $97,900, marking a gain of roughly 21%. While many investors see this as a sign of recovery, a closer look indicates this rally may be repeating historical patterns.
This upward move is notable, but the price still hasn’t reclaimed the long-term 365-day moving average (MA), with resistance currently near $101,000. Bitcoin has failed to hold above this level, showing bulls have yet to fully take control.
2022 vs. 2026 Trend Comparison
On-chain analytics platform CryptoQuant highlights that this Bitcoin movement closely mirrors the rebound seen during the 2022 bear market: back then, the price dropped below the 365-day MA, bottomed out, and rebounded, but selling pressure near the long-term trend line prevented a sustained bull run.
In 2022, BTC bounced nearly 47% from the bear market low, but ultimately fell after hitting resistance at the annual moving average. Now, the recent 19–21% rally faces similar resistance. If Bitcoin faces another rejection, the bear market may continue rather than end.
Why Technical Indicators Matter
The 365-day moving average (MA) serves as a critical threshold in long-term technical analysis, marking the direction of the market trend. If the price can reclaim and hold above this MA, it’s usually seen as a strong signal of a trend reversal. If the price remains below, the market is typically still in a downward channel.
Currently, Bitcoin’s rally has failed to break through this key technical level. Short-term performance remains fragile, with resistance overhead and the market in an uncertain phase. If the price drops below recent lows, it could trigger further selling pressure.
Exchange Inflows and Market Sentiment Analysis
Another important indicator is the amount of BTC flowing into exchanges. Recent data shows Bitcoin inflows to exchanges are rising, which often signals that investors are preparing to sell rather than hold. Increased inflows may point to higher selling pressure, not new capital entering the market.
Even though price indexes have climbed, investor sentiment remains cautious. Historically, bear markets have seen short-lived rebounds, and excessive optimism can leave investors vulnerable to being misled by these technical rebounds.
Investor Risks and Potential Future Trends
Overall, despite Bitcoin’s recent strong rebound, it’s not enough to confirm a long-term trend reversal. If BTC fails to break out and hold above the $101,000 level, a pullback or continued bear market may follow. Conversely, a clear breakout above this resistance could fuel higher price expectations.
For investors, it’s critical to determine whether this rally truly signals a bull market foundation. Technical indicators, trading volume, and capital flows are all key references for assessing future trends.
Conclusion:
Despite BTC’s more than 21% gain, market analysis indicates this is more likely a technical rebound within a bear market than confirmation of a bull market. The price has yet to break through key trend lines and long-term moving average resistance, so risks persist. Tracking these technical and capital flow indicators can help clarify future market direction.
Related Articles

AI-Native Settlement Layers: How United Stables Is Building the Next Financial Rail

The ve(3,3) Flywheel Explained: How AERO Tokenomics Powers Aerodrome’s DeFi Economy

How Does PAXG Work? In-Depth Overview of the Physical Gold Tokenization Mechanism

Aerodrome Tokenomics: How ve(3,3) Powers Base's Most Profitable DEX

How is the price of PAXG determined? Pegging mechanism, trading depth, and influencing factors
