2026 XRP Price Forecast: $1.88 Triple-Bottom Support and ETF Fund Outflows — What’s the Next Move?
1. Market Overview
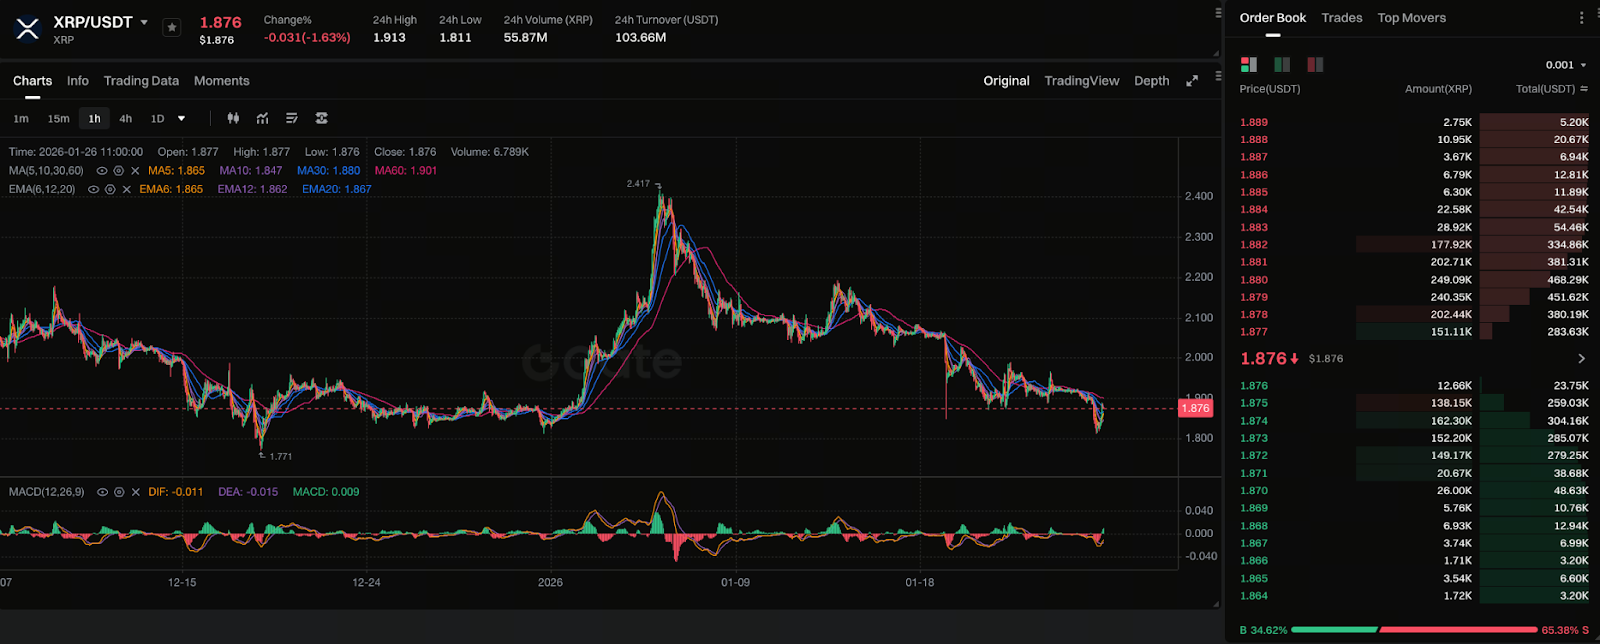
Chart: https://www.gate.com/trade/XRP_USDT
As of January 26, 2026, XRP is consolidating near $1.88, just below the recent $1.90 resistance zone. Multiple crypto media reports indicate that the price has repeatedly tested this level, establishing a clear technical support that has drawn attention to whether this area can hold and spark a rebound.
At the same time, the market is contending with a range of macro and micro factors. Weakness in leading assets like Bitcoin and volatile ETF capital flows are exerting both direct and indirect pressure on XRP prices. These mixed influences have led to a generally cautious market sentiment.
2. XRP Technical Structure and Support Analysis
Technically, both daily and short-term charts for XRP show a converging downward channel, with the price repeatedly finding support between $1.88 and $1.85. Meanwhile, moving average indicators—including the 50EMA, 100EMA, and 200EMA—highlight significant resistance zones above, limiting short-term upside potential.
Importantly, volume and RSI indicators suggest that downward momentum is waning, signaling that selling pressure may be easing. If this support holds and is accompanied by increased volume, a technical rebound could emerge. Conversely, if the $1.85 support breaks, the price may further test $1.80 or lower.
The classic triple-bottom pattern is essentially repeated testing of the same support without a decisive breakdown, theoretically indicating weakening selling pressure. When combined with volume and price reversal signals, this pattern often points to a rebound opportunity. As a result, market watchers see this area as a key battleground.
3. ETF Capital Impact and Market Sentiment Analysis
Recently, capital flow data related to XRP ETFs has shown significant volatility, directly affecting market liquidity and investor sentiment. Exchange data reveals that XRP spot ETFs have seen capital outflows, interpreted as short-term profit-taking or strategic adjustments by institutions, rather than a fundamental rejection of XRP.
ETF outflows typically bring downward pressure on prices, but it’s important to recognize that such capital rotation doesn’t mean the market is giving up on XRP—it simply reflects changing allocation strategies. If ETF capital returns over time, it could provide price support and potentially drive an upswing.
Additionally, user voting data indicates that the majority of traders expect XRP’s price to remain in the $1.50–$2.00 range, suggesting that short-term sentiment still favors stable range trading.
4. Comparative Scenarios for Price Forecasts
Market forecasts for XRP’s future price vary widely:
- Cautious scenario: If XRP fails to hold the $1.88 support, it may move into lower ranges and enter a prolonged consolidation phase.
- Neutral scenario: The price fluctuates between $1.88 and $2.06, awaiting clearer fundamental or technical breakout signals.
- Optimistic scenario: If the price breaks above the $1.95–$2.00 resistance, it could move toward higher targets, and under bull market conditions, see even greater upside potential.
Some market analysts, considering long-term volatility and fundamental trends, suggest that XRP could have greater upside potential in the future. However, such forecasts should be weighed carefully, considering timeframes and risk tolerance.
5. Risk Warning and Investor Strategy Advice
XRP, like the broader crypto market, is highly volatile. Short-term traders should closely monitor the key $1.88 support level and adjust positions based on price structure. Long-term investors should evaluate fundamental developments—including XRP ecosystem growth, regulatory changes, and ETF structure evolution.
Regardless of strategy, risk management—such as stop-loss settings and position sizing—is essential for navigating high volatility.
6. Conclusion: XRP Outlook Assessment
Considering current technicals and capital flows, XRP is at a critical support zone, with bulls and bears vying for control. In the short term, prices may remain range-bound, but if positive signals emerge from technical or capital perspectives, the next phase of medium-term upside could unfold. Investors should remain patient and cautious, making decisions based on comprehensive information.
Related Articles

AI-Native Settlement Layers: How United Stables Is Building the Next Financial Rail

The ve(3,3) Flywheel Explained: How AERO Tokenomics Powers Aerodrome’s DeFi Economy

How Does PAXG Work? In-Depth Overview of the Physical Gold Tokenization Mechanism

Aerodrome Tokenomics: How ve(3,3) Powers Base's Most Profitable DEX

How is the price of PAXG determined? Pegging mechanism, trading depth, and influencing factors
