2026 Epic Showdown: Will DEX Really Overtake CEX This Time?
Is DEX poised to replace CEX?
From a modest market share in 2020 to this year’s rapid rise in trading volume, decentralized exchanges are becoming increasingly prominent.
Is the DEX surge really just around the corner? Or is it still a bit early?
Don’t be too quick to celebrate decentralization’s victory—and don’t dismiss DEXs based on outdated criticisms about complexity or poor user experience.
Read this report first. The answer will become clear.
2025: The Year DEX Liquidity Takes Off
After two years of gradual progress, 2025 marks the true takeoff for DEX liquidity.
Both in scale and growth rate, DEX trading volumes have soared—total volume is nearly four times higher than before.
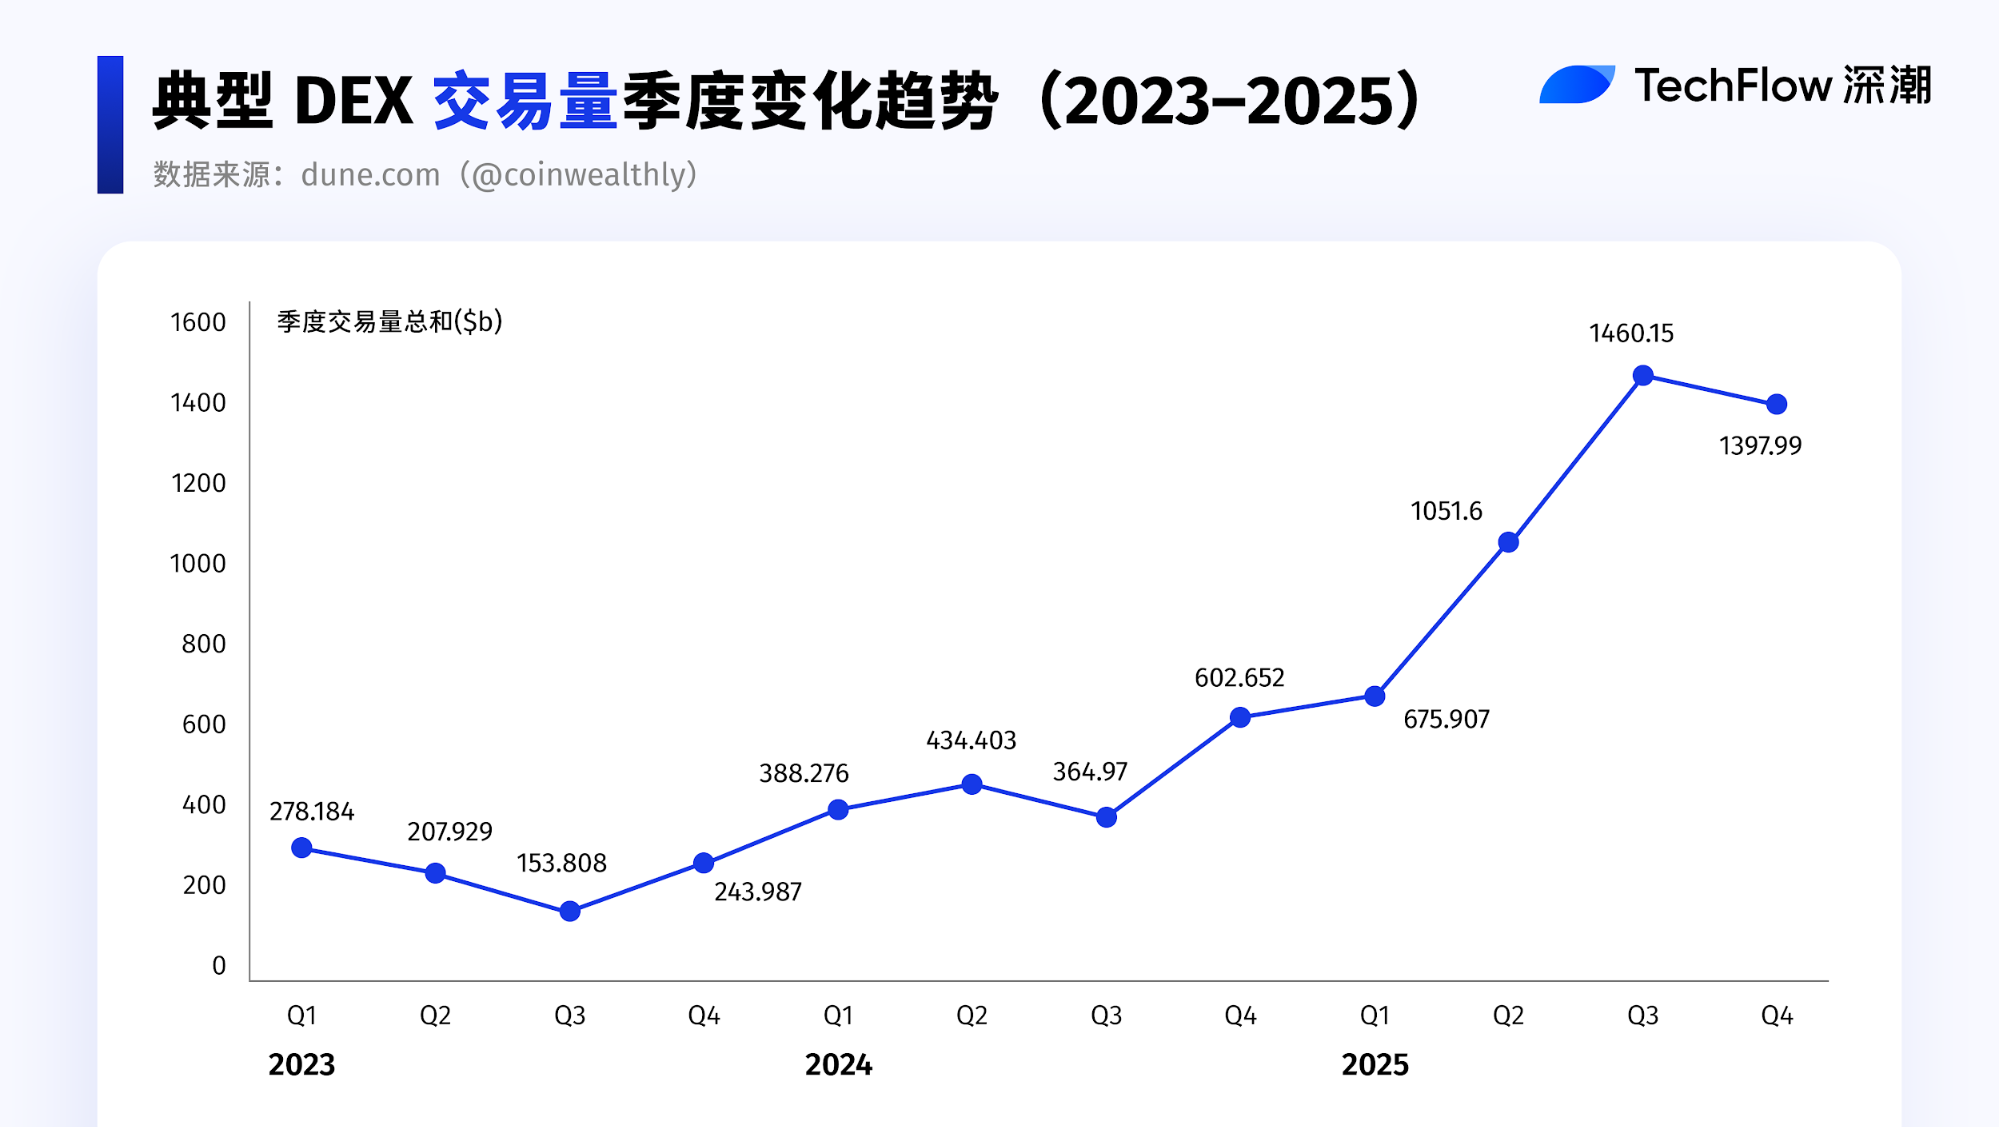
Breaking it down by quarter, this surge didn’t happen overnight.
2025’s takeoff is a direct continuation of the growth trend seen in Q4 2024.
It was in Q4 2024 that DEX trading activity and liquidity began to accelerate, and this momentum was fully amplified in the following year.
In short, DEXs hit a pivotal turning point in Q4 2024, and 2025 carried that trend forward and magnified it.
Turning Point Review: Q4 2024 Acceleration and 2025 Amplification
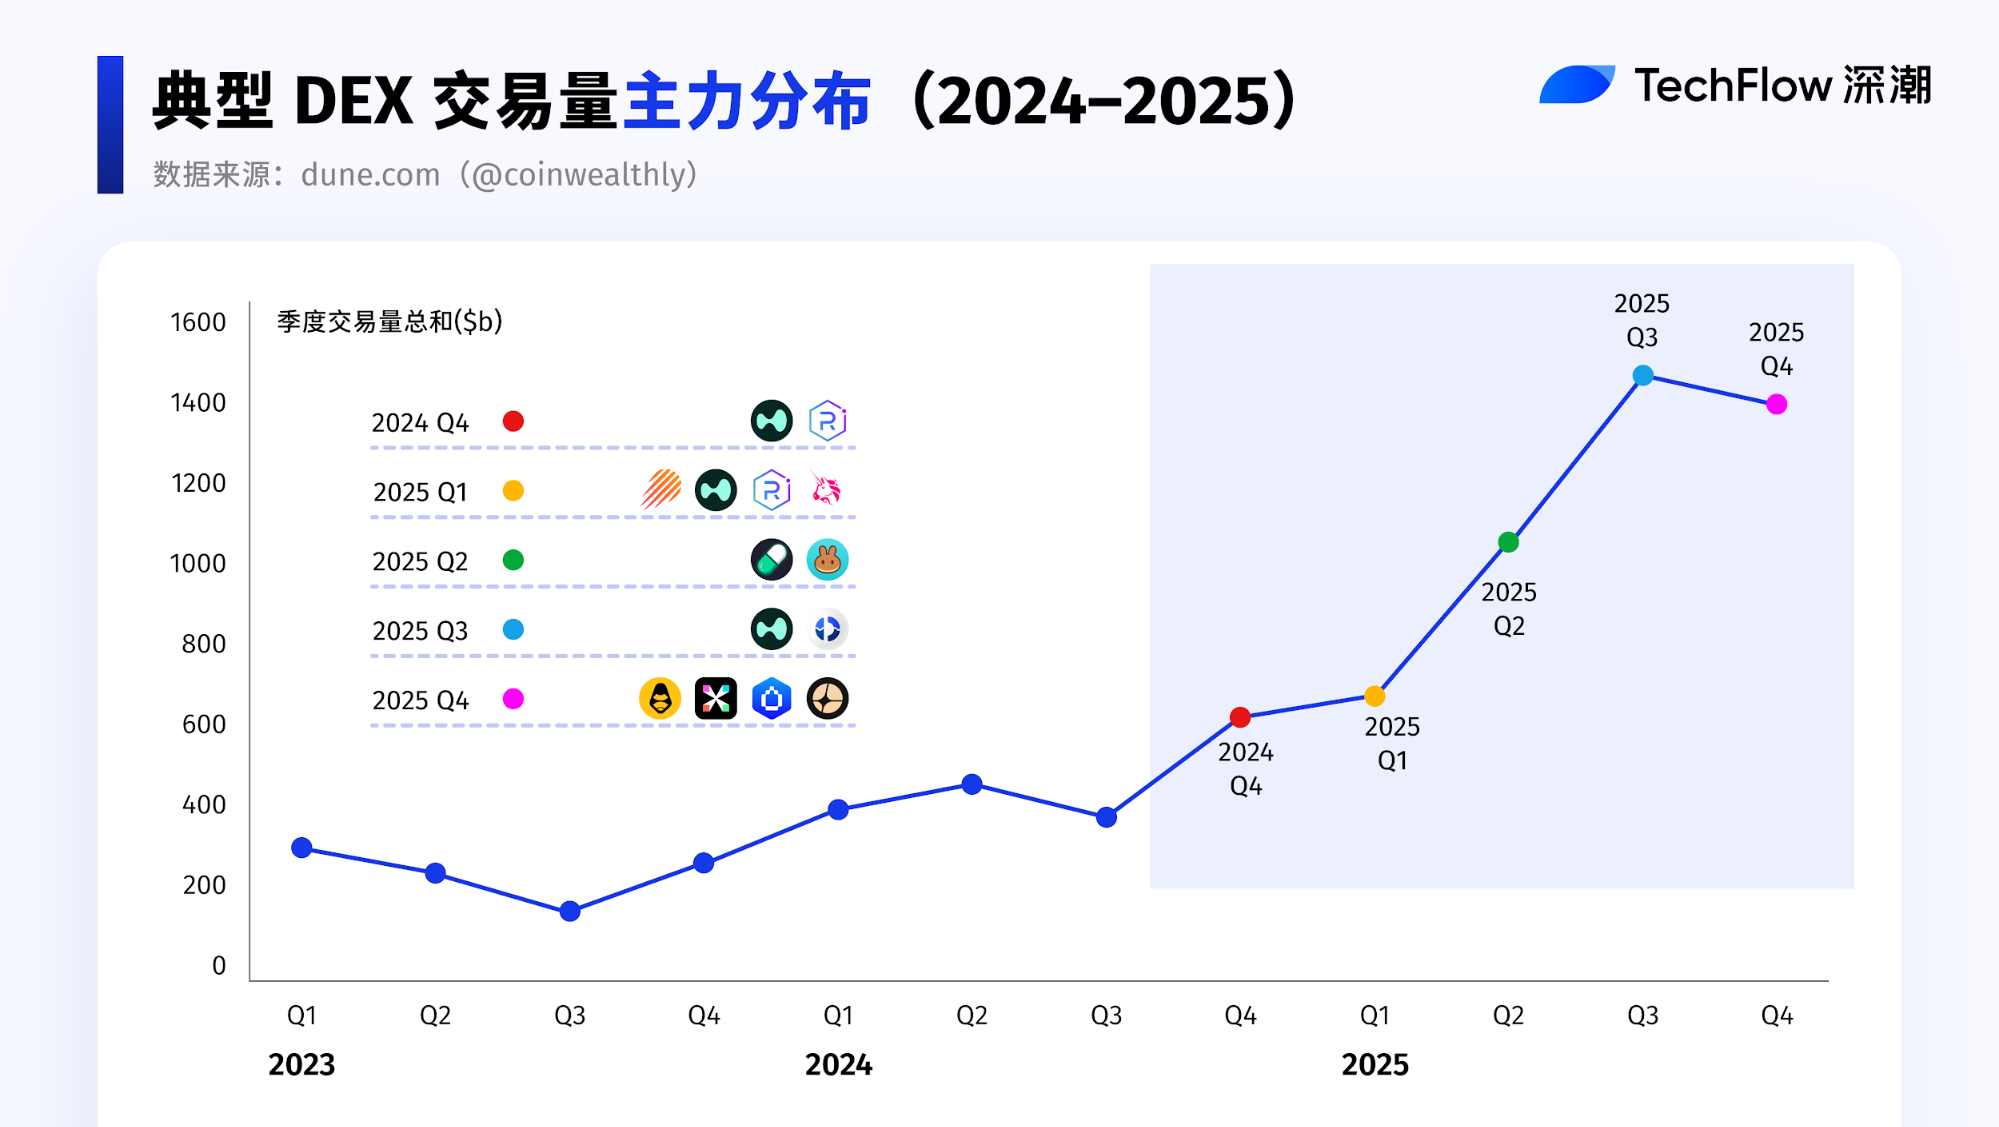
Quarterly Recap: Who Led Each Quarter?
2024 Q4: Trend Initiation
- Solana ecosystem DEX trading volume surpassed Ethereum for the first time on a quarterly basis, with notable activity gains—becoming the core liquidity driver for this phase.
- The AI narrative and new token launch platforms continually produced new trading pairs, sharply increasing DEX trading frequency and cumulative volume.
- Solana DEX: Most new token trading happened on Solana DEXs, driven by “graduation” and “migration” processes from platforms like Pump.fun. In Q4 2024, Raydium absorbed substantial follow-up liquidity and trading for new tokens, further solidifying its role as the core spot trading venue in Solana.
- Hyperliquid: Leveraging a successful HYPE airdrop and product design, Hyperliquid rapidly expanded its share in the decentralized perpetual contracts market, now holding over 55% market share.
2025 Q1: Ranking Shifts and Hotspot Rotation
- The contest for top DEX became a “musical chairs” game, with leading ecosystems frequently swapping places in trading volume.
- During periods of active trading in celebrity memes and AI meme tokens, Solana ecosystem DEX volume surged, temporarily taking the lead.
- As meme coin trading cooled in February–March, Ethereum regained the top spot in DEX trading volume in March, supported by more robust liquidity and structural capital flows.
- CEX custody risks surfaced: Some users began shifting to non-custodial, on-chain verifiable DEXs, driving migration in trading behavior.
2025 Q2: Ecosystem Synergy and Capital Migration
- PancakeSwap: Binance’s Alpha project routed trades to PancakeSwap, directly boosting BSC ecosystem DEX activity. PancakeSwap became the biggest beneficiary of cross-ecosystem collaboration, with quarterly trading volume soaring 539.2%.
- The Ethereum Pectra upgrade went live, triggering strong market reactions. Ethereum surged nearly 44% during the Asian morning session—the largest single-day gain since 2021. The market narrative shifted from Solana and meme trading to broader ecosystem allocation.
- As liquidity migration accelerated, competition between Solana and BSC showed a clear siphoning effect, with capital and trading activity rotating rapidly between ecosystems.
2025 Q3: Fierce Competition and Product Integration
- CEX trading volume growth became more pronounced, driving a rebound in overall market activity.
- Uniswap: Uniswap regained some market share and, alongside PancakeSwap, became a leading force in the DEX market.
- Perp DEX competition intensified. Challengers like Aster, Lighter, and edgeX rapidly expanded in trading volume and user base, directly competing with top platform Hyperliquid. The market entered a fierce competition stage, with platforms using airdrops, points, and zero-fee incentives to attract active traders, further boosting on-chain derivatives demand.
- DEX Ecosystem: DEX aggregators and infrastructure continued to improve, enhancing user experience, retention, and stickiness.
- Jupiter: Jupiter Lend attracted over $1 billion in deposits within ten days of launch. Previously limited lending demand within the Solana ecosystem was quickly activated. With Fluid’s underlying lending architecture, Jupiter Lend’s explosive growth further validated the strong appeal of the DEX + lending model for capital.
2025 Q4: Extreme Market Disruptions and Sector Divergence
- The 1011 liquidation event triggered extreme market conditions, temporarily boosting trading volume and causing data spikes. The event exposed systemic risk at the CEX level, while cascading liquidations and leveraged positions impacted DEXs.
- Lighter and edgeX: As market confidence gradually recovered, the Perp DEX sector returned to growth. Platforms like Lighter and edgeX rapidly expanded in trading volume and user base, narrowing the gap with Hyperliquid and pushing the Perp DEX market into intense competition.
- Aster: CZ publicly disclosed holdings of ASTER, after which Aster secured listings on major exchanges like Binance and Robinhood. As a leading Perp DEX in the BSC ecosystem, Aster is positioned to compete directly with Solana-based Hyperliquid in the perpetual contract DEX sector.
- HumidiFi: In the spot DEX segment, Uniswap’s market share has continued to decline since Q3, with emerging platforms like HumidiFi capturing some volume. This reflects a shift from a single dominant leader to a more diversified spot DEX landscape.
After analyzing the top performers each quarter, let’s break down Perp DEX and Spot DEX in more detail.
Perp DEX: The True Growth Engine of 2025
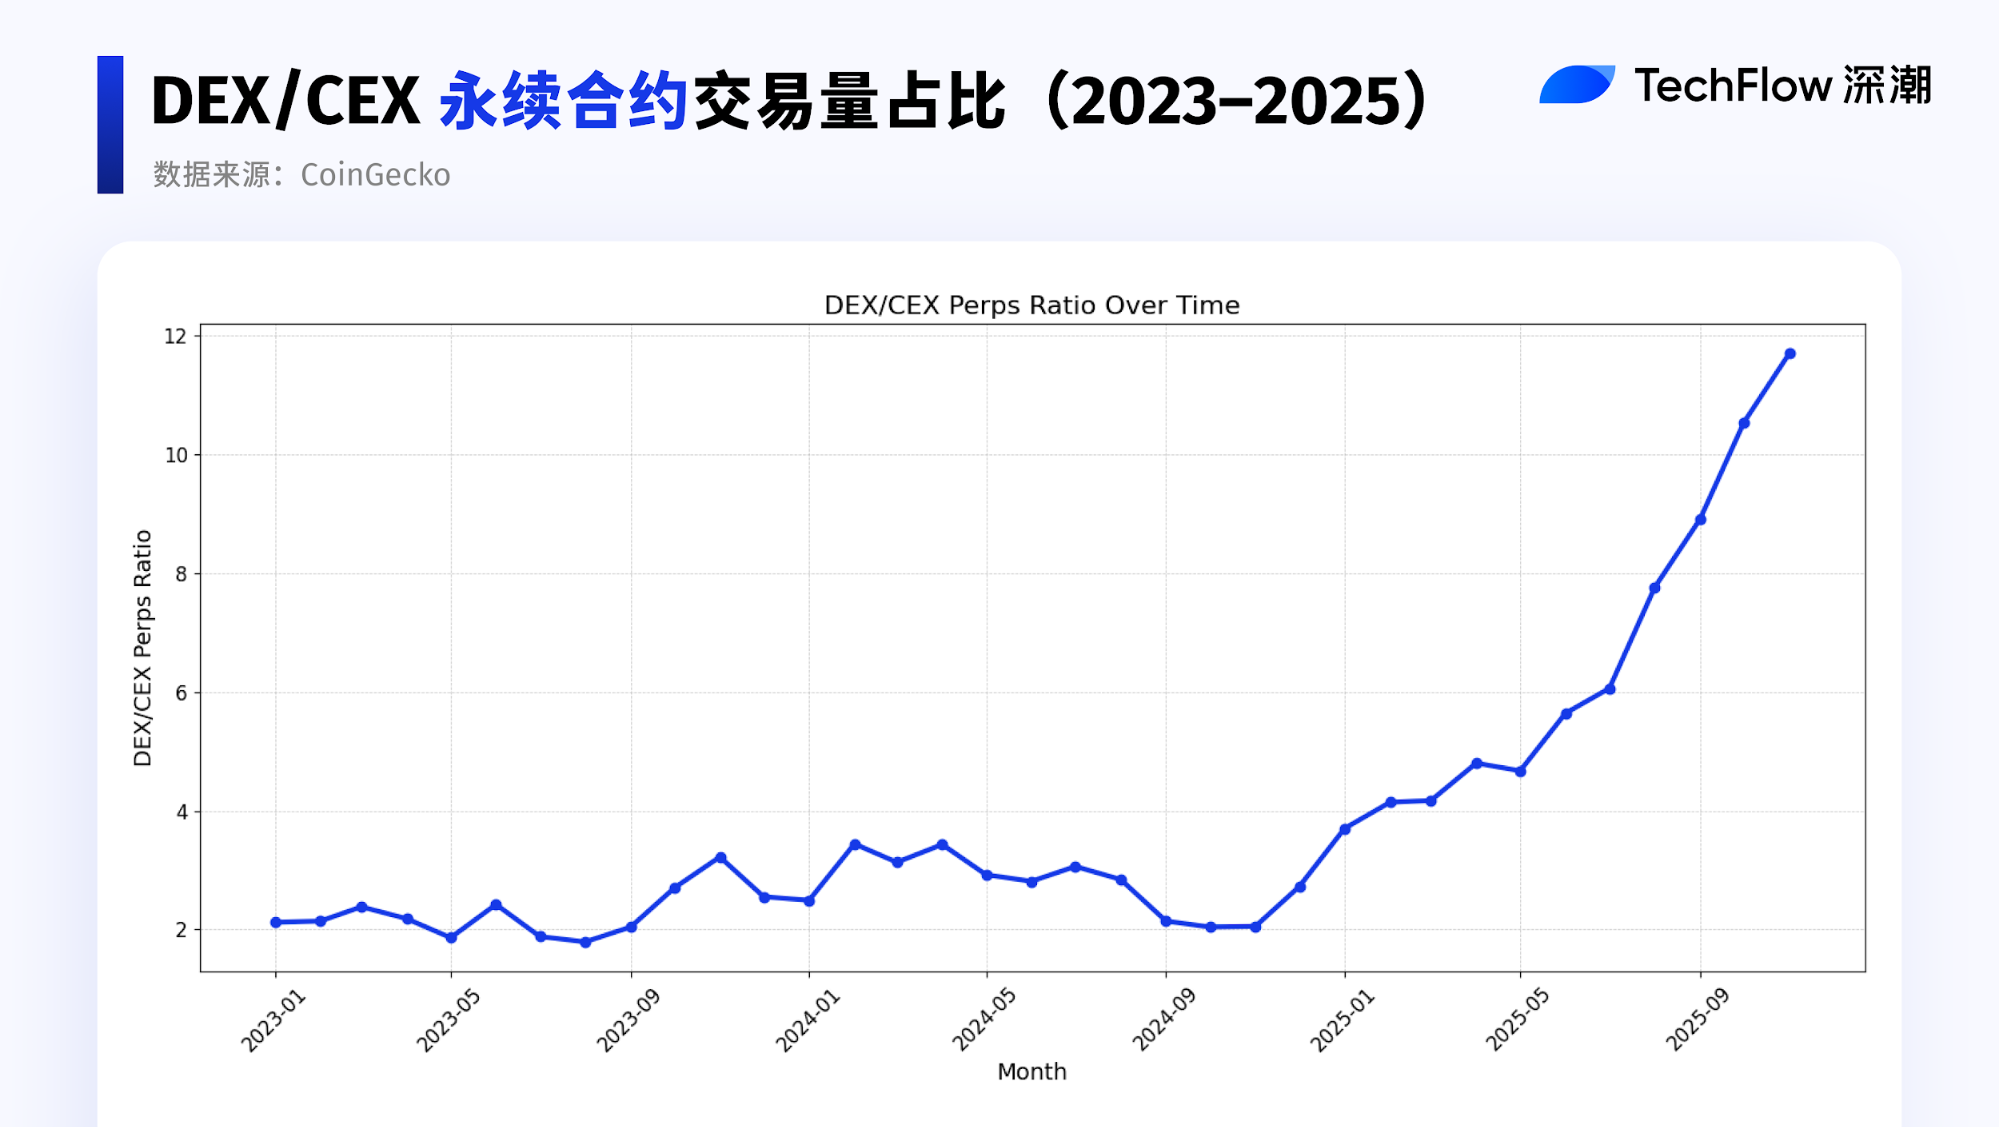
This section reviews data from the past three years to observe the share of perpetual contract trading volume between DEXs and CEXs.
The indicator rose sharply throughout 2025, whereas previous years showed more moderate performance.
2025 is the true breakout year for Perp DEXs.
According to DeFiLlama, Perp DEX trading volume increased by $7.348 trillion in 2025 alone.
For comparison, from early 2021 through the end of 2024, cumulative perpetual contract DEX volume was only $4.173 trillion.
In other words, Perp DEXs achieved approximately 176% net trading volume growth in 2025. The incremental volume for the year has already far surpassed the total of the previous four years.
Starting from Q3, trading volume accelerated sharply. As competition intensified and new products matured, the perpetual contract DEX sector drew sustained market attention, with liquidity levels rising in tandem.
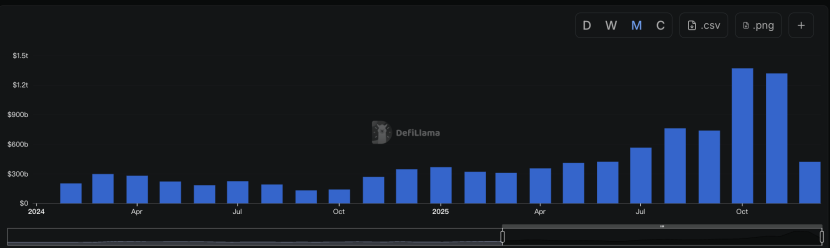
From limited early scale and scattered participation to a surge fueled by market sentiment and capital structure, Perp DEX activity is entering a new magnitude.
Perp Volume: The Core Indicator of Capital Turnover Intensity
Perp DEXs excel at enabling rapid capital movement.
From a metrics perspective, Perp Volume (perpetual contract trading volume) is the key indicator for measuring perpetual contract DEXs.
It reflects both the intensity of capital turnover and frequency of use.
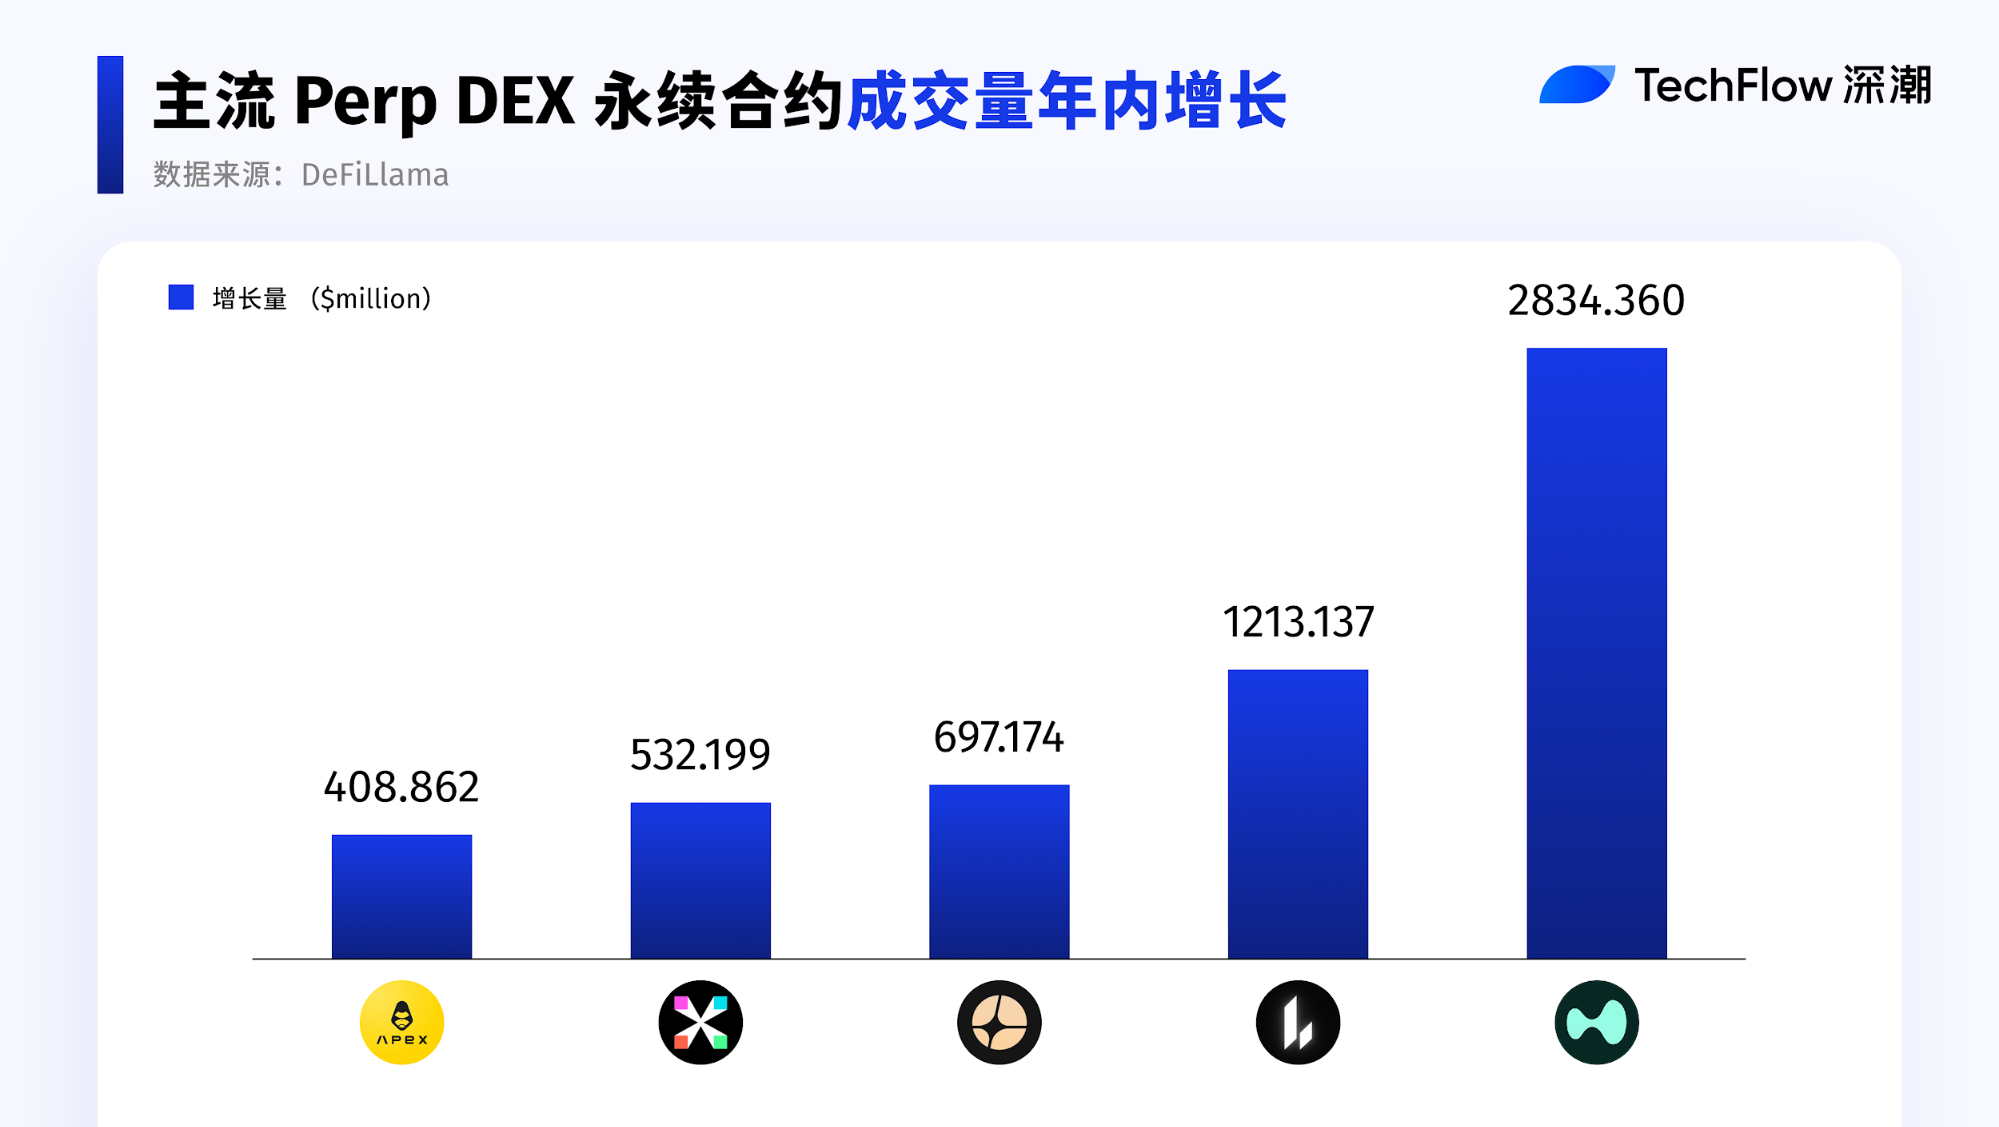
Annual Perp Volume Growth Highlights:
- Hyperliquid and Lighter have maintained rapid growth since 2025, with both trading activity and capital turnover efficiency increasing in tandem.
- Aster surged after Q3, becoming one of the fastest-growing platforms of the year.
- By contrast, established platforms dYdX and GMX did not rank among the top annual gainers. While their cumulative historical trading volume remains impressive, their incremental volume in 2025 was below $100 million, and overall growth was noticeably slower.
Open Interest: Risk Exposure and Top-End Concentration
For Perp DEXs, Open Interest (the total nominal value of outstanding contracts) is a critical metric.
Simply put: if Perp Volume represents flow, OI represents stock.
Perp Volume indicates trading activity, while OI shows whether capital is willing to stay on the platform.
Perpetual contracts’ trading volume reflects liquidity and matching activity; the actual amount of capital parked on the platform is revealed by OI.
From the platform side, OI reflects the protocol’s ability to bear risk and handle capital scale.
From the user side, OI shows trading demand and capital stickiness.
Once Perp Volume reaches sufficient liquidity and activity, we further screen for the top five protocols by OI performance.
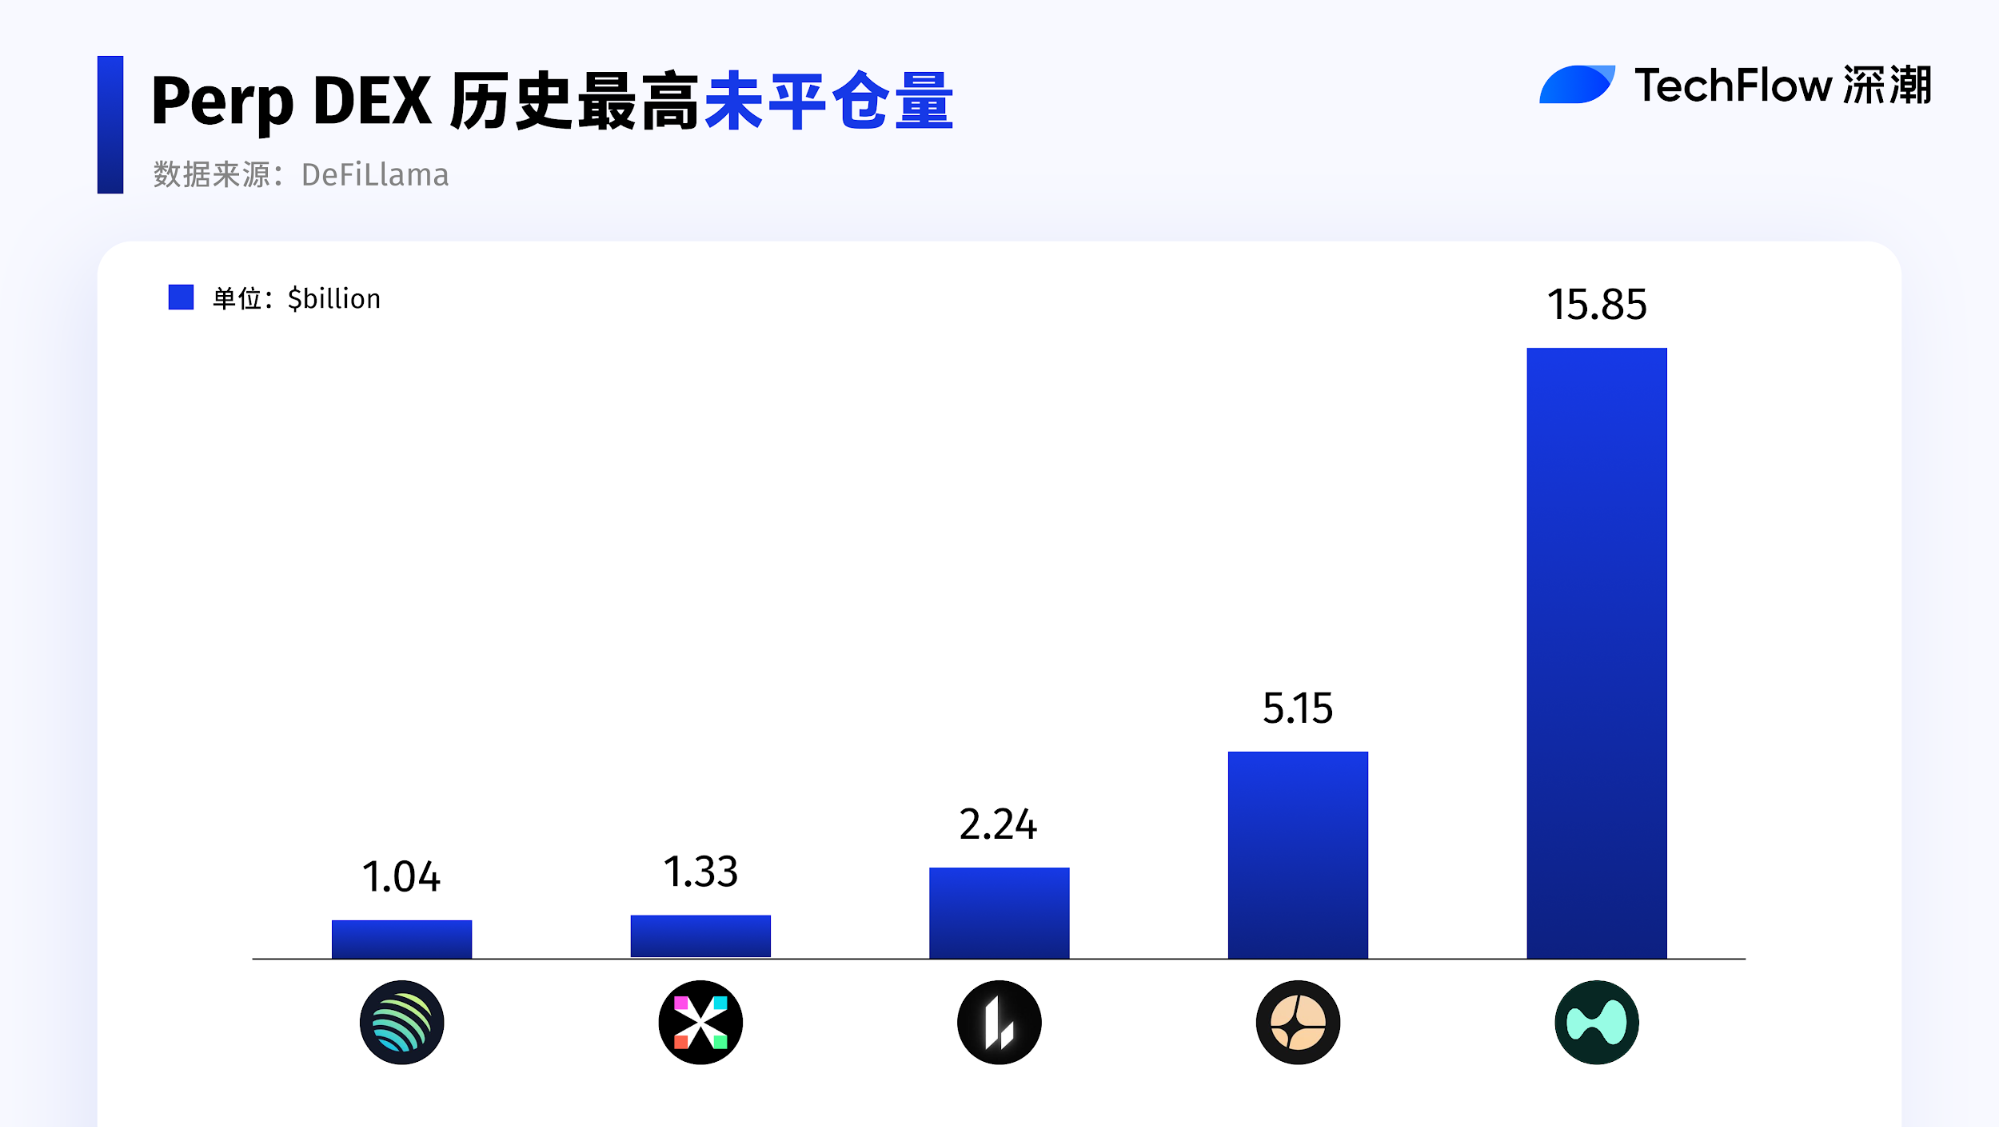
OI is highly concentrated. The top five protocols capture the vast majority of open interest, with a clear gap: the sixth-ranked protocol has only about one-third the OI of the fifth, creating a sharp divide. Perp DEX capital is extremely sensitive to depth, stability, and liquidation mechanisms, with positions tending to concentrate on a few mature platforms.
After 10·11: Divergent Recovery Patterns Among Perp DEXs
As trading fervor faded and risk was released, differentiation among Perp DEXs shifted from transaction scale to capital retention and resilience after ATH OI drawdowns.
Aster:
- After Q3 market momentum, Aster showed the strongest capital retention capability.
After hitting an OI peak on October 5, its retention rate relative to ATH OI remained above 72% well into Q4; following the 1011 event, its ecosystem recovery was also among the fastest and most stable.
Lighter:
- Lighter also recovered quickly, with current OI rebounding to about 87% of ATH—a clear sign of capital returning.
Hyperliquid:
- Although Hyperliquid still has the largest overall scale, its OI fell over 60% from ATH. As of now, OI has only recovered to about 61% of the pre-1011 average, signaling a noticeable weakening.
Perp Revenue Performance: Growth Differences by Protocol Type
With so much capital attracted, the key question is: are these protocols actually profitable?
That brings us to protocol revenue.
Below, we select representative Perp DEX protocols
to analyze their revenue performance and trends during the 2025 cycle.
Four types of protocols are compared:
- Hyperliquid: the leading specialized Perp DEX
- Jupiter: a multi-service platform with Perp DEX capabilities
- edgeX: a specialized new competitor
- GMX: a veteran Perp DEX protocol
Before analyzing, we segment the market:
First, by product focus:
- Specialized Perp DEX
- Multi-service platforms (Perp as one business line)
Second, by lifecycle stage:
- New entrants
- Mature protocols
- Established protocols
The core goal of this segmentation is to answer:
Which protocol type and stage has the strongest revenue growth momentum?
It’s important to note that looking only at absolute revenue growth does not capture the true trends of 2025.
Therefore, we use December 2024 as the base period and analyze month-over-month revenue growth for a clearer picture of speed and differences.
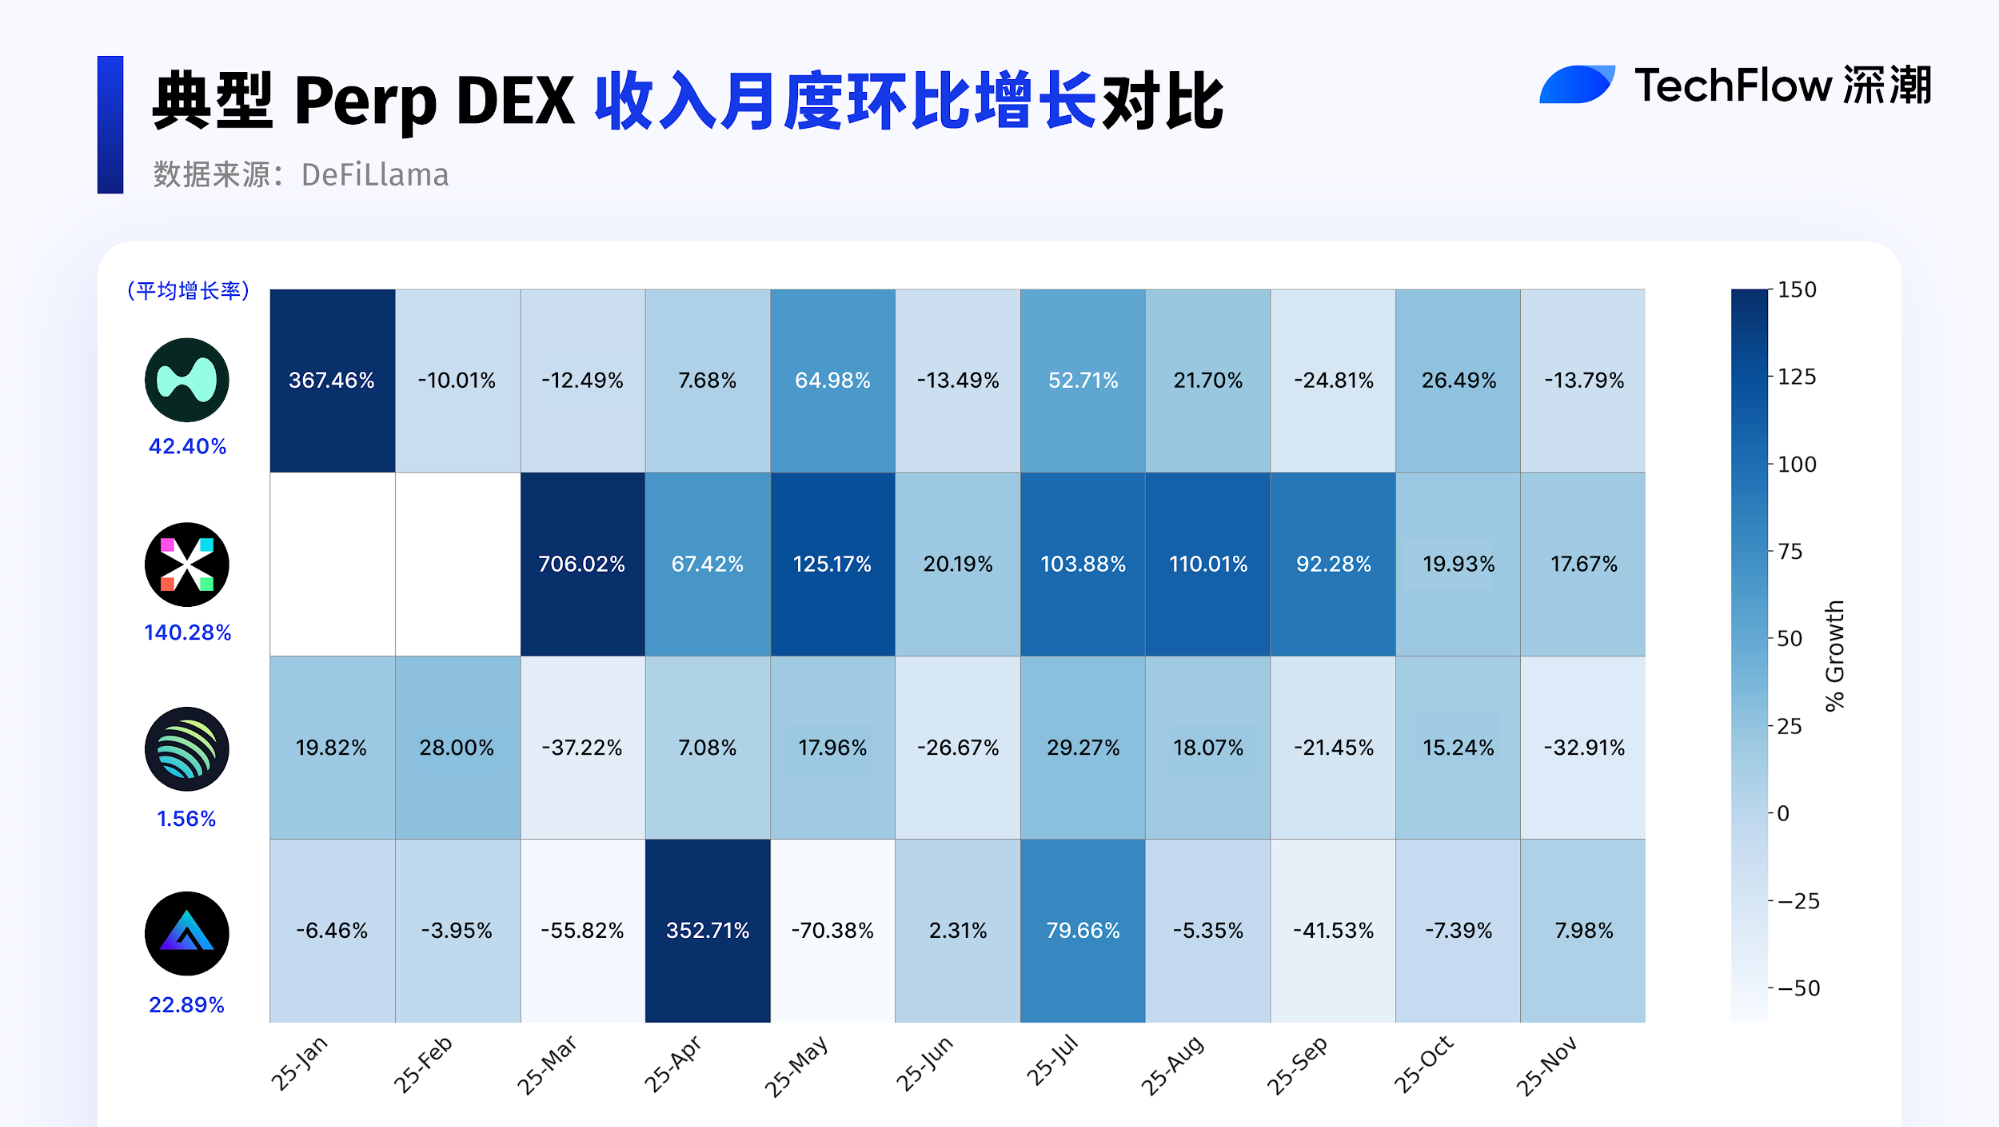
The heatmap clearly shows July as a turning point for rapid revenue growth across multiple protocols.
Specifically:
- edgeX posted the most prominent gains in 2025.
Although growth slowed after September, edgeX still led in average annual growth rate. As a successful startup Perp DEX, its yearly revenue performance remained impressive.
- Hyperliquid, now in a growth phase, saw stable expansion from a high base. Overall, revenue remained high, though marginal growth slowed.
- Jupiter, which mainly serves as a trading gateway and routing layer, executes trades at the protocol level, requiring fee revenue to be shared with the execution layer. Revenue growth lagged trading volume expansion, resulting in a flatter overall trend.
- GMX posted an average revenue growth rate of about 22%. As an established protocol, growth mainly came from user retention. If it can sustain this growth rate on its existing base, the business model remains viable long-term.
Spot DEX: Liquidity Depth and Ecosystem Competition
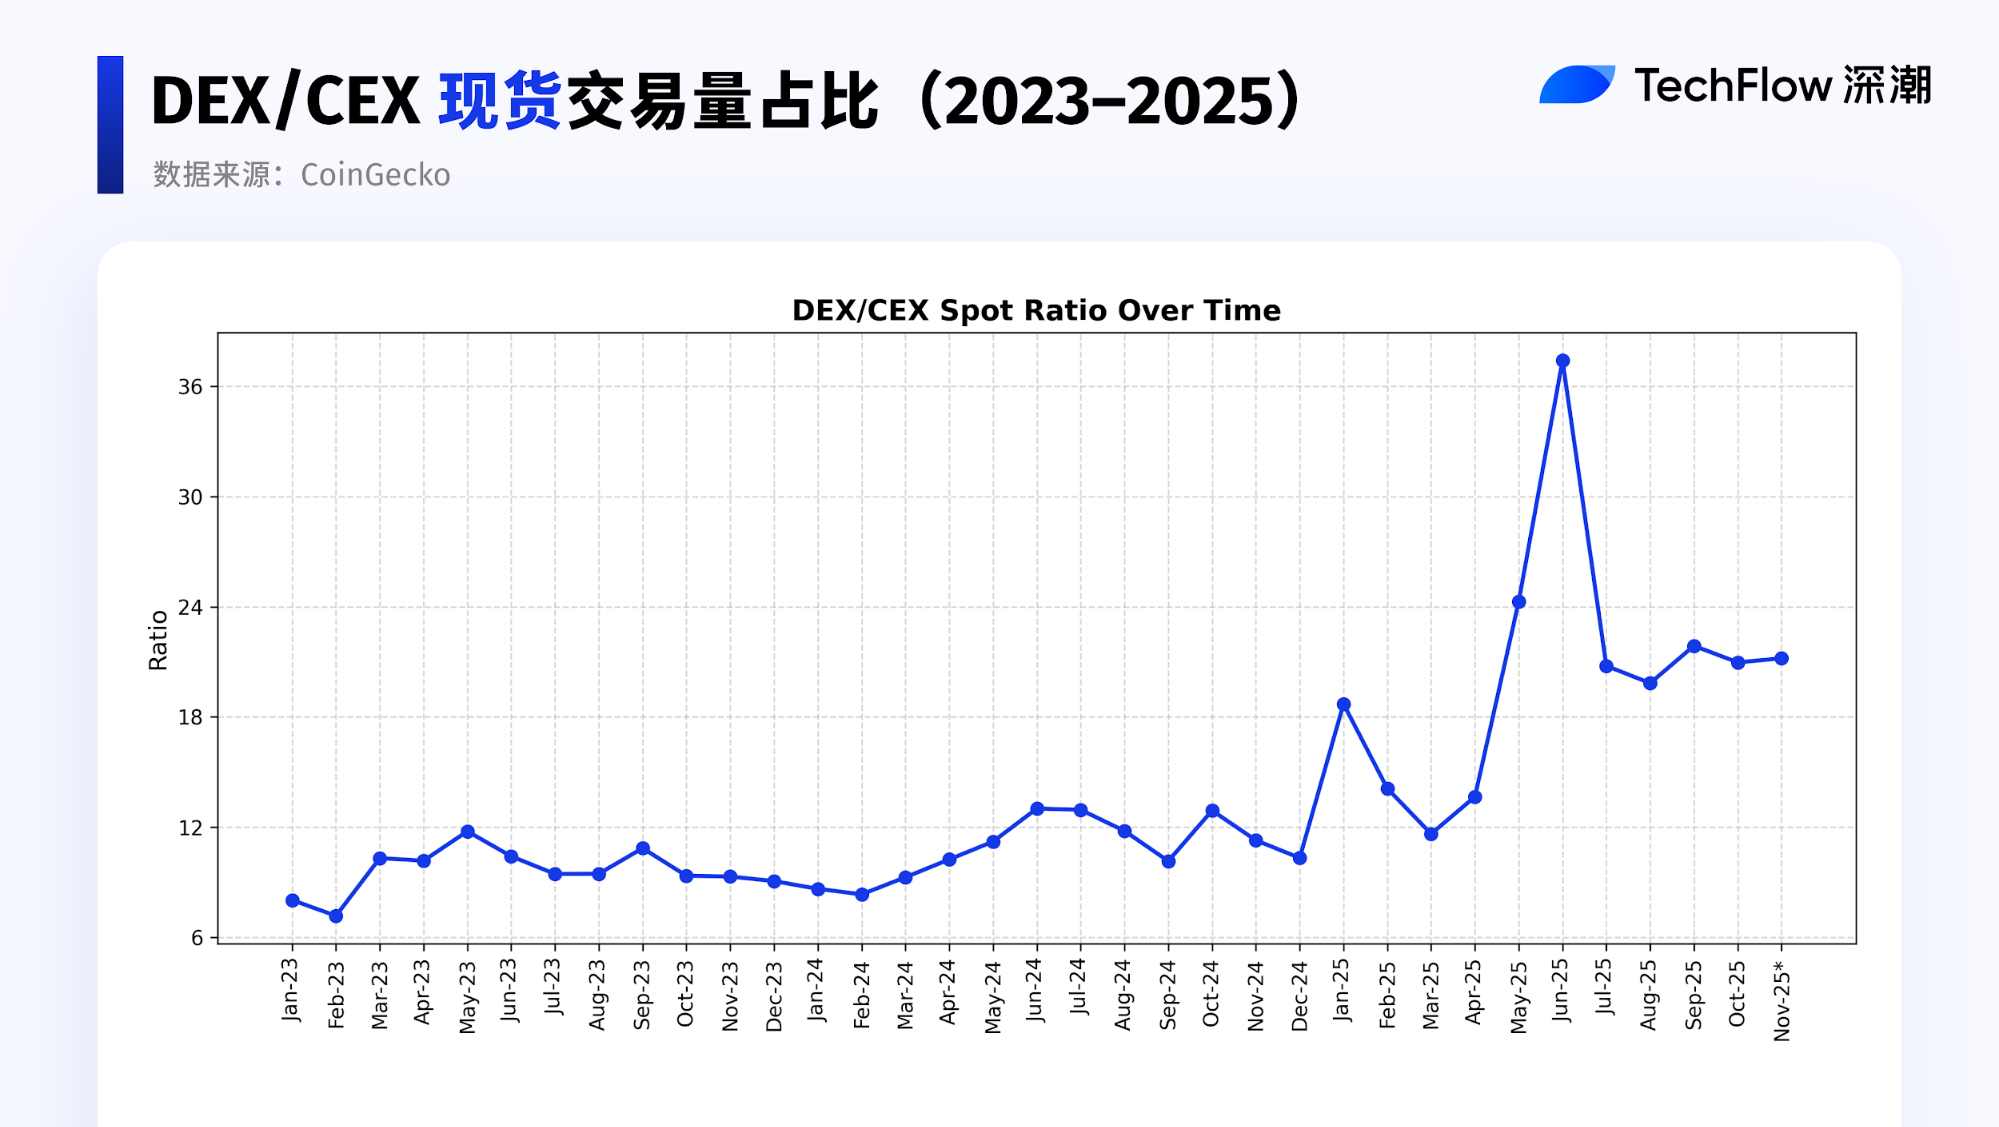
Compared to the previous two years, the DEX/CEX spot trading volume ratio also climbed significantly in 2025, peaking in June and rebounding again in Q4.
TVL: Spot Liquidity Depth and Capital Commitment
In the Spot DEX system, TVL mainly comes from LPs providing assets to trading pools. Higher TVL means more capital is willing to bear impermanent loss and contract risk, participate in market making, and earn fees or incentives. TVL reflects capital’s assessment of Spot DEX rules, risk structure, and long-term sustainability, making it a key reference for spot DEX rankings.
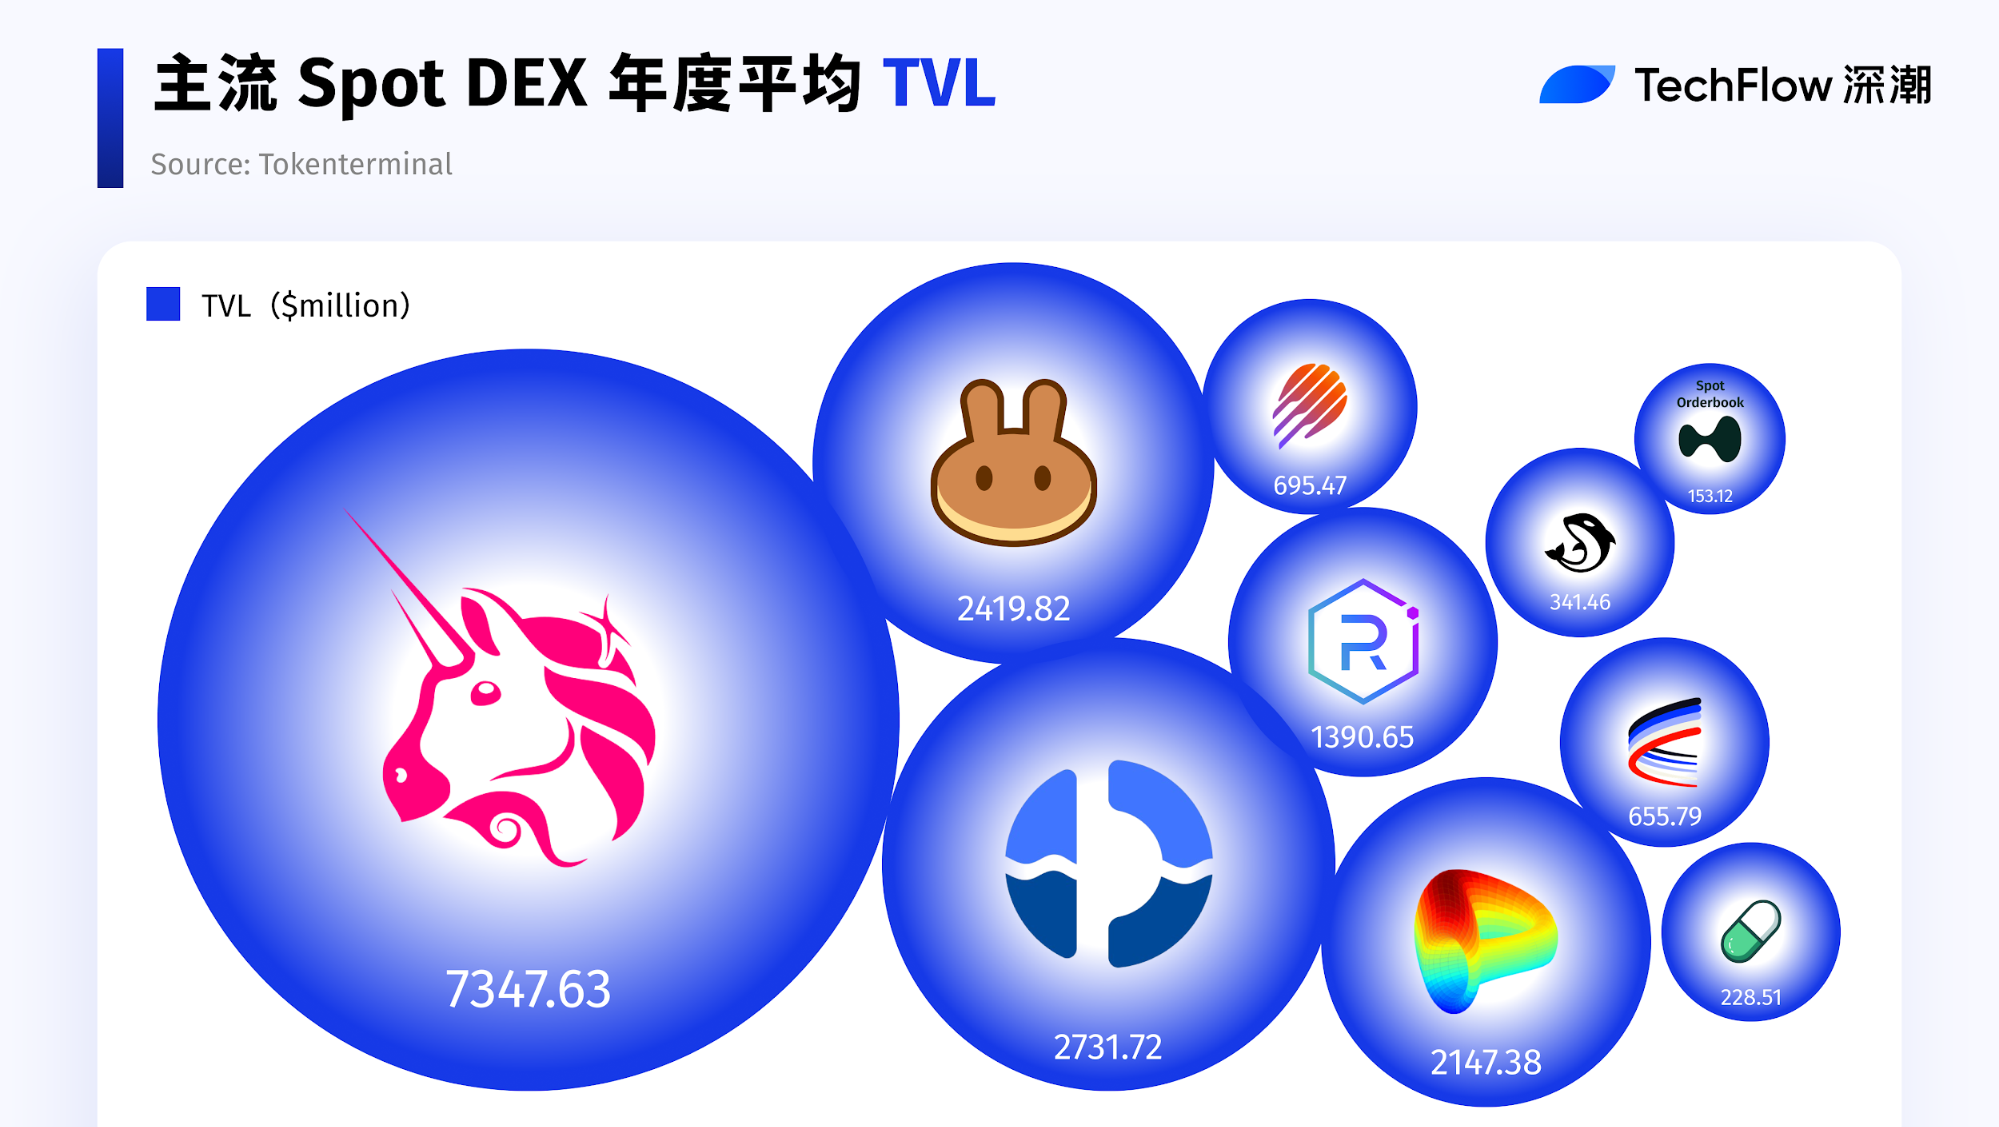
Uniswap leads with about $7.3 billion in TVL, maintaining clear liquidity dominance and serving as the core trading hub for the Ethereum ecosystem.
Fluid and PancakeSwap form the second tier, each with TVL above $2 billion, benefiting from cross-ecosystem expansion and rising BSC trading activity, with strong growth momentum this year.
Curve and Raydium are in the middle range. Curve mainly handles stablecoin and low-volatility asset trading, with stable TVL but slower expansion; Raydium is tightly integrated with the Solana ecosystem, mainly reflecting liquidity changes within a single ecosystem.
Among the top ten protocols by average TVL in 2025, Fluid posted the most notable growth, reaching about $5 billion in Q3. PancakeSwap also saw significant expansion in the same period.
Trading Volume: Solana Ecosystem’s Collective Rise
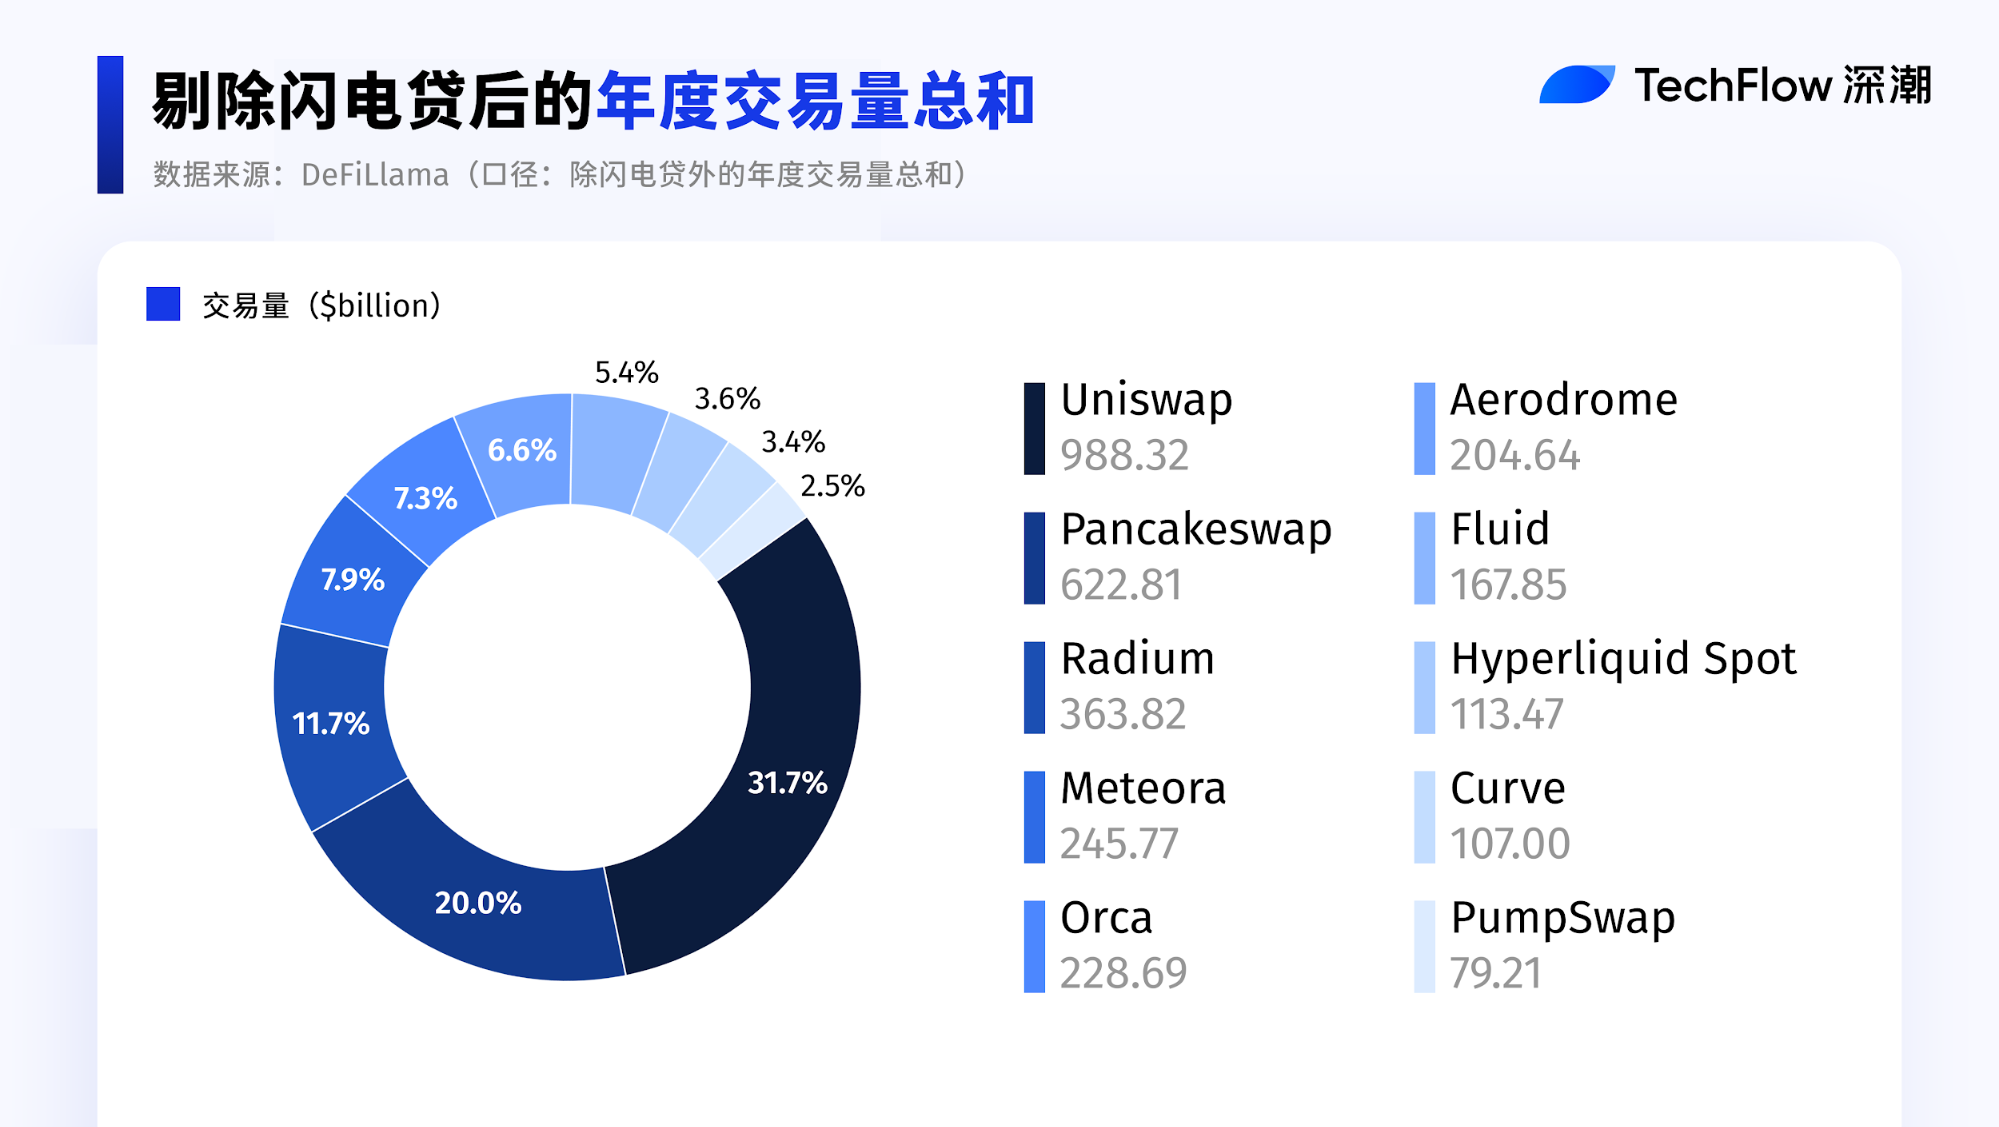
This analysis uses annual trading volume totals excluding flash loans. Flash loans often use small, instantaneous capital exposure to inflate nominal trading volume, skewing metrics—so they are excluded for a more accurate reflection of real demand.
Uniswap and PancakeSwap still dominate, together accounting for over half the market, indicating mainstream spot DEX liquidity remains highly concentrated among a few top protocols.
Notably, the combined share of Solana ecosystem DEXs is now close to Uniswap alone, highlighting Solana’s rising competitiveness in spot DEX trading. However, Solana’s internal market remains fragmented across multiple protocols.
P/F Volatility Insights: 2025 Spot DEX Milestones
With such scale, how profitable are Spot DEXs—the key DeFi component? Let’s look at the data.
This article focuses on annual performance and discusses only stage changes. In 2025, many protocols introduced token buybacks or burns, fee distribution, and structural adjustments, reducing the explanatory power of FDV.
Therefore, we use circulating market cap P/F ratio to measure how much value the market assigns to each unit of fee revenue.
P/F does not directly reflect profit levels, but illustrates market expectations for Spot DEX monetization potential at current activity levels.
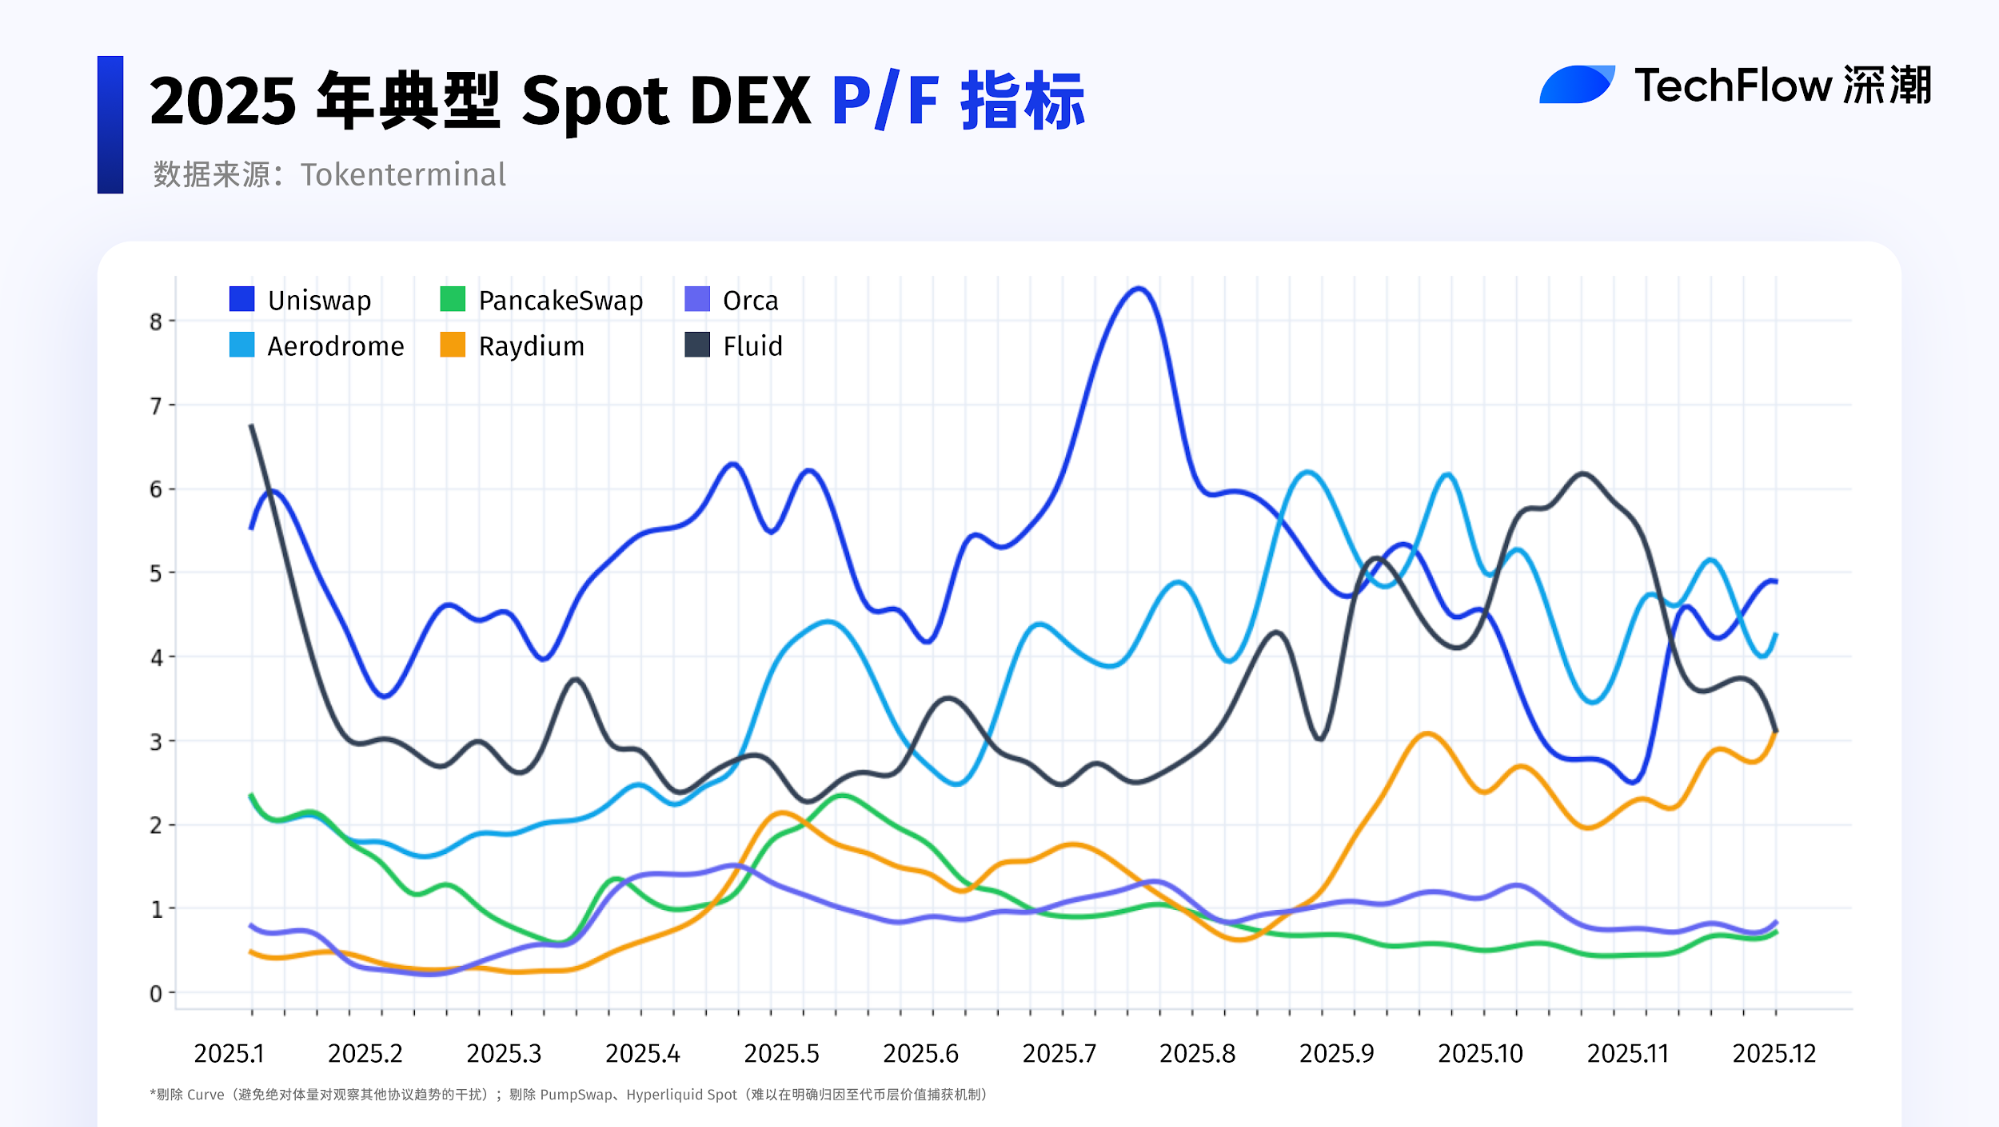
To avoid absolute scale distorting trends for other protocols, Curve is omitted from the current chart and used only for background analysis. PumpSwap and Hyperliquid Spot are also excluded, as their value capture mechanisms cannot be clearly attributed to the token layer.
Curve’s P/F remained relatively high throughout the year, peaking at about 28 in May before falling to around 7 by July. Compared to about 10 at the start of the year, this is a slight decrease.
It’s important to note Curve’s P/F is much higher than other protocols, mainly due to its consistently low fee levels. Curve’s pricing curve is designed specifically for stablecoins and low-volatility assets (such as stablecoin pairs, stETH/ETH LST trading), delivering extremely low slippage and high capital efficiency through optimized AMM design.
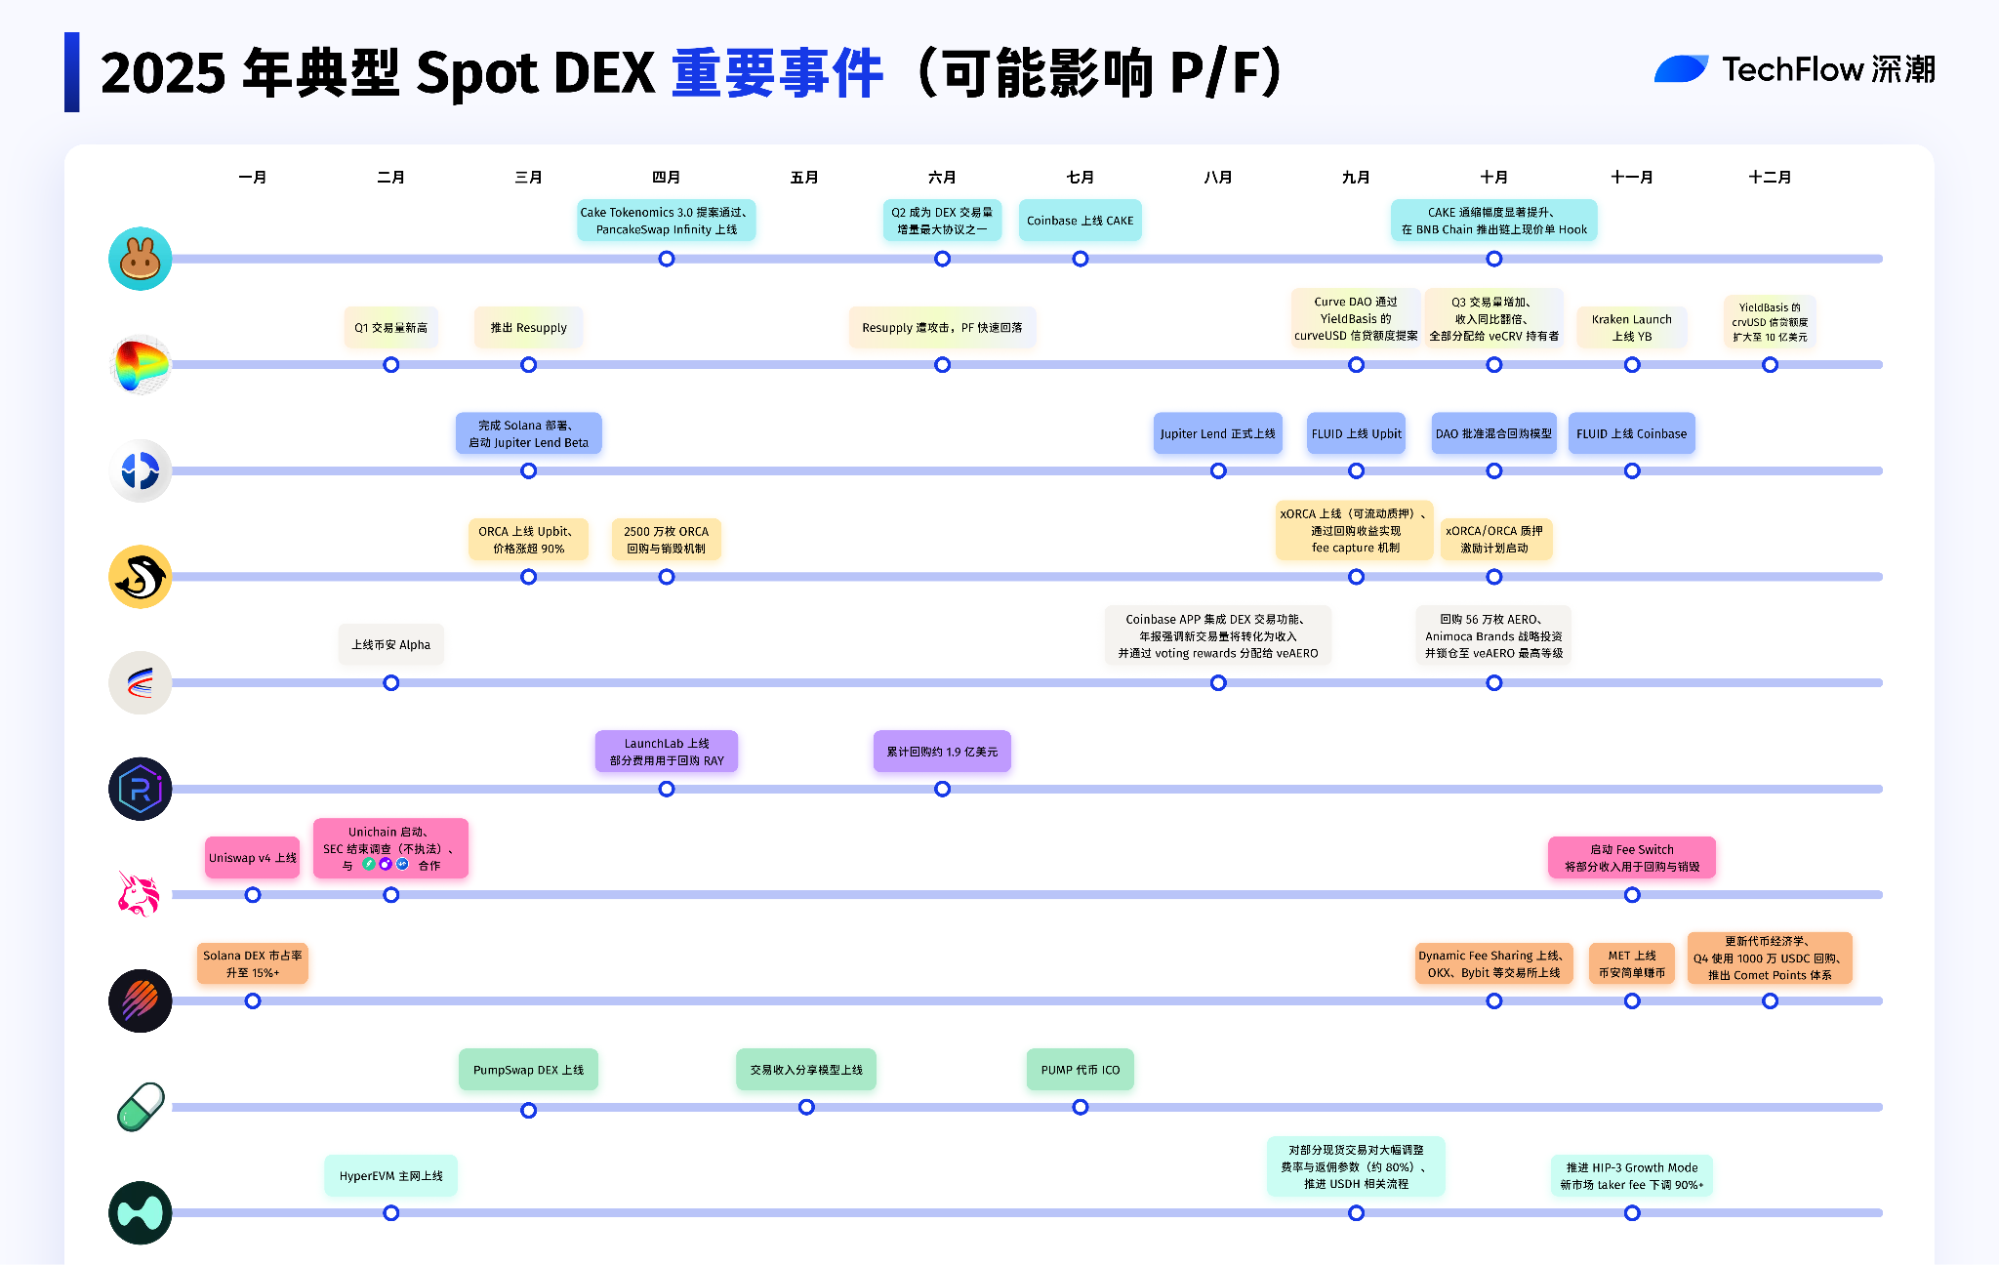
In addition, Curve’s 2025 YieldBasis mechanism further focuses on reducing LP impermanent loss and securing provider returns.
Based on the above chart, we have summarized the top ten Spot DEX events in 2025 that influenced P/F trends, to help you review this year of innovation and vitality.
So, back to the original question: Is DEX really about to replace CEX?
Whether it’s the leap in trading volume or the rising DEX/CEX ratio this year, one thing is clear: DEXs have become a major trading venue that can’t be ignored.
Especially in perpetual contracts, Perp DEX trading volume reached historic highs in 2025, with capital turnover efficiency and top platform capacity pushing the market to a new level.
But this isn’t a straightforward replacement. 2025 marks the start of a “dual evolution”: DEXs are actively learning from CEXs, improving matching efficiency, user experience, risk control, and product completeness; meanwhile, CEXs are evolving toward DEXs, emphasizing self-custody, on-chain transparency, and verifiable settlement and clearing.
Ultimately, the relationship between DEX and CEX may not be a zero-sum game. More likely, each will play to its strengths in different layers and scenarios, jointly building the next-generation infrastructure for crypto trading and settlement.
It’s not about replacement, but collaboration; not confrontation, but co-construction.
In 2025, this trend is already close at hand. Is the day of a new order taking shape still far off?
Disclaimer:
- This article is republished from [TechFlow]. Copyright belongs to the original author [Cecelia]. For any concerns regarding republication, please contact the Gate Learn team, who will handle the matter promptly according to relevant procedures.
- Disclaimer: The views and opinions expressed in this article are solely those of the author and do not constitute investment advice.
- Other language versions of this article are translated by the Gate Learn team. Do not copy, distribute, or plagiarize translated articles unless Gate is explicitly mentioned.
Related Articles

In-depth Explanation of Yala: Building a Modular DeFi Yield Aggregator with $YU Stablecoin as a Medium

Sui: How are users leveraging its speed, security, & scalability?

What Is a Yield Aggregator?

Dive into Hyperliquid

Aster vs Hyperliquid: Which Perp DEX Will Prevail?