2025 Crypto Market Liquidity Report – From Quantitative Easing to Structural Differentiation Under Institutional Compliance
Introduction
2025 marks a paradigm shift in the crypto market from “macro-sentiment” to “compliance and microstructure” drivers. Despite global rate cuts, the linear logic of “Rate Cuts = Bull Market” failed, giving way to profound structural differentiation. BTC exhibited high correlation with tech stocks, while RWAs and Stablecoins surged as new liquidity reservoirs. As pricing power shifts from VCs to the secondary market and on-chain derivatives reshape trading, this report analyzes the 2025 liquidity landscape and forecasts a 2026 “Structure-Driven” cycle dominated by institutional pricing.
Abstract
The year 2025 marks a paradigm shift in the crypto market from “macro-sentiment driven” to “microstructure and compliance driven.” Despite the global entry into a rate-cutting cycle, the market did not experience a broad-based rally. Instead, it demonstrated profound structural differentiation.
- Macro Logic Reconstruction: Crypto Assets Exhibit Higher Correlation with Risky Assets. The linear logic of “Rate Cuts = Bull Market” failed in 2025. Amidst macro uncertainty, crypto assets demonstrated a high correlation (High Beta) with US tech stocks rather than independent safe-haven attributes. Traditional institutional willingness to hold assets increased, with institutions like ETFs replacing retail investors as the market’s marginal pricing anchor, significantly enhancing the transmission efficiency of macro volatility to the crypto market.
- New On-Chain Reservoir: RWA Breakout in a Zero-Sum Game. In an environment where total network TVL saw only a marginal increase of +4.40%, representing a stock-flow game (competition for existing liquidity), the RWA/Stablecoin sector achieved explosive growth of +133%, ranking second with a net inflow of $9.42B. Stablecoins are accelerating their spillover from being purely “transaction settlement tools” to infrastructure for “Treasury Yield” and “Commercial Payments (PayFi),” becoming the new ballast for liquidity.
- Primary Market Valuation Remoring: Pricing Power Ceded to Secondary Market. Financing rhythm showed significant hysteresis, with a V-shaped reversal in financing amounts appearing only after macro certainty was established (Rootdata shows October financing at $3.6B, compared to Q2 at $2.25B and Q3 at $3.12B). In the first half of the year, up to 27.59% of projects experienced “valuation inversion,” forcing the market to undergo mandatory correction via new token mechanisms on top exchanges (such as Alpha Mode) in the second half. Pricing power has thoroughly shifted from VC narratives to secondary market liquidity.
- Microstructure Stratification: Derivatives Dominance and the Matthew Effect. The secondary market presents a characteristic of “Robust Indices, Bleeding Long-Tail.” The market share of BTC and stablecoins continues to expand, while altcoin liquidity faces exhaustion amidst compliance screening. The proportion of contract (futures/perps) trading has increased significantly. On-chain derivatives represented by Hyperliquid are reshaping the trading landscape, but also exposing liquidity fragility under high leverage (e.g., the 10.11 Flash Crash).
- 2026 Outlook: Moving Towards a “Structure-Driven” New Cycle. The key market variable will shift from the “magnitude of rate cuts” to the “transmission efficiency of compliant capital.” With the implementation of frameworks like the GENIUS Act, the market will enter a “Structure-Driven” era dominated by institutional pricing power. Assets that can provide Real Yield and financial infrastructure value within compliant frameworks will be the core targets to cross the cycle.
I. Macro Paradigm Reconstruction: Asset Attribute Correction and Liquidity Transmission Blockage
1. “Digital Gold” or “High-Beta Tech Stock”?
1.1 Market Performance: Divergence between Macro Expectations and Asset Performance
2025 marks a structural turning point for the macro positioning of crypto assets. Although major economies successively entered rate-cutting cycles, constrained by macro liquidity that remained substantially tight, the market lacked incremental capital support and did not exit the expected Broad-based Rally.
Conversely, after the Federal Reserve confirmed rate cuts, the market exhibited a distinct “Sell the Fact” effect. Bitcoin price retraced from a peak of $126K in October 2025 to approximately $86K in mid-December, with overall market capitalization shrinking by about 25.00%. In contrast, gold prices rose over 65% year-to-date (by mid-December), marking their best performance in a decade. This drastic divergence in asset performance confirms that the crypto market is undergoing profound microstructure adjustments and macro logic reconstruction.
1.2 Structural Evolution: The Institutional Migration of Pricing Hegemony
Paradigm Shift from Retail-Driven to Institutional Allocation: In 2025, ETF fund flows established themselves as the market’s Marginal Pricing Anchor. According to CoinShares’ 2025 Institutional Crypto Report, annual net inflows into crypto ETFs reached $59.5B. Meanwhile, the pricing influence of retail investors declined significantly. Based on Coinbase Institutional’s annual and quarterly disclosure data, institutional investors dominated the market in terms of volume, with Institutional Trading Volume maintaining around 80% of the total. In 2025, on-chain “retail participation heat” did not strengthen synchronously. This structural change significantly increased the sensitivity of crypto asset price formation mechanisms to macro liquidity, interest rates, and institutional allocation behaviors, rather than being dominated by sentiment-driven retail exchanges.
1.3 Macro Logic: Blockage of Monetary Policy Transmission Mechanism—The Failure of the “Rate Cut = Crypto Bull” Linear Logic
Against the backdrop of rising recession expectations, three rate cuts in 2025 (September, October, December) lowered rates from 4.5% to 3.75%. However, liquidity did not effectively convert into buying pressure for risk assets; instead, it exposed BTC’s current attribute as a Risk-on Asset rather than a Safe-haven Asset. Although monetary policy released liquidity, constrained by the expansion of the US fiscal deficit, uncertainty in tariff policies, and geopolitical friction, safe-haven funds prioritized flowing back to US Treasuries and Gold. Crypto assets were at the tail end of this macro liquidity distribution and failed to capture the main overflow of safe-haven capital.
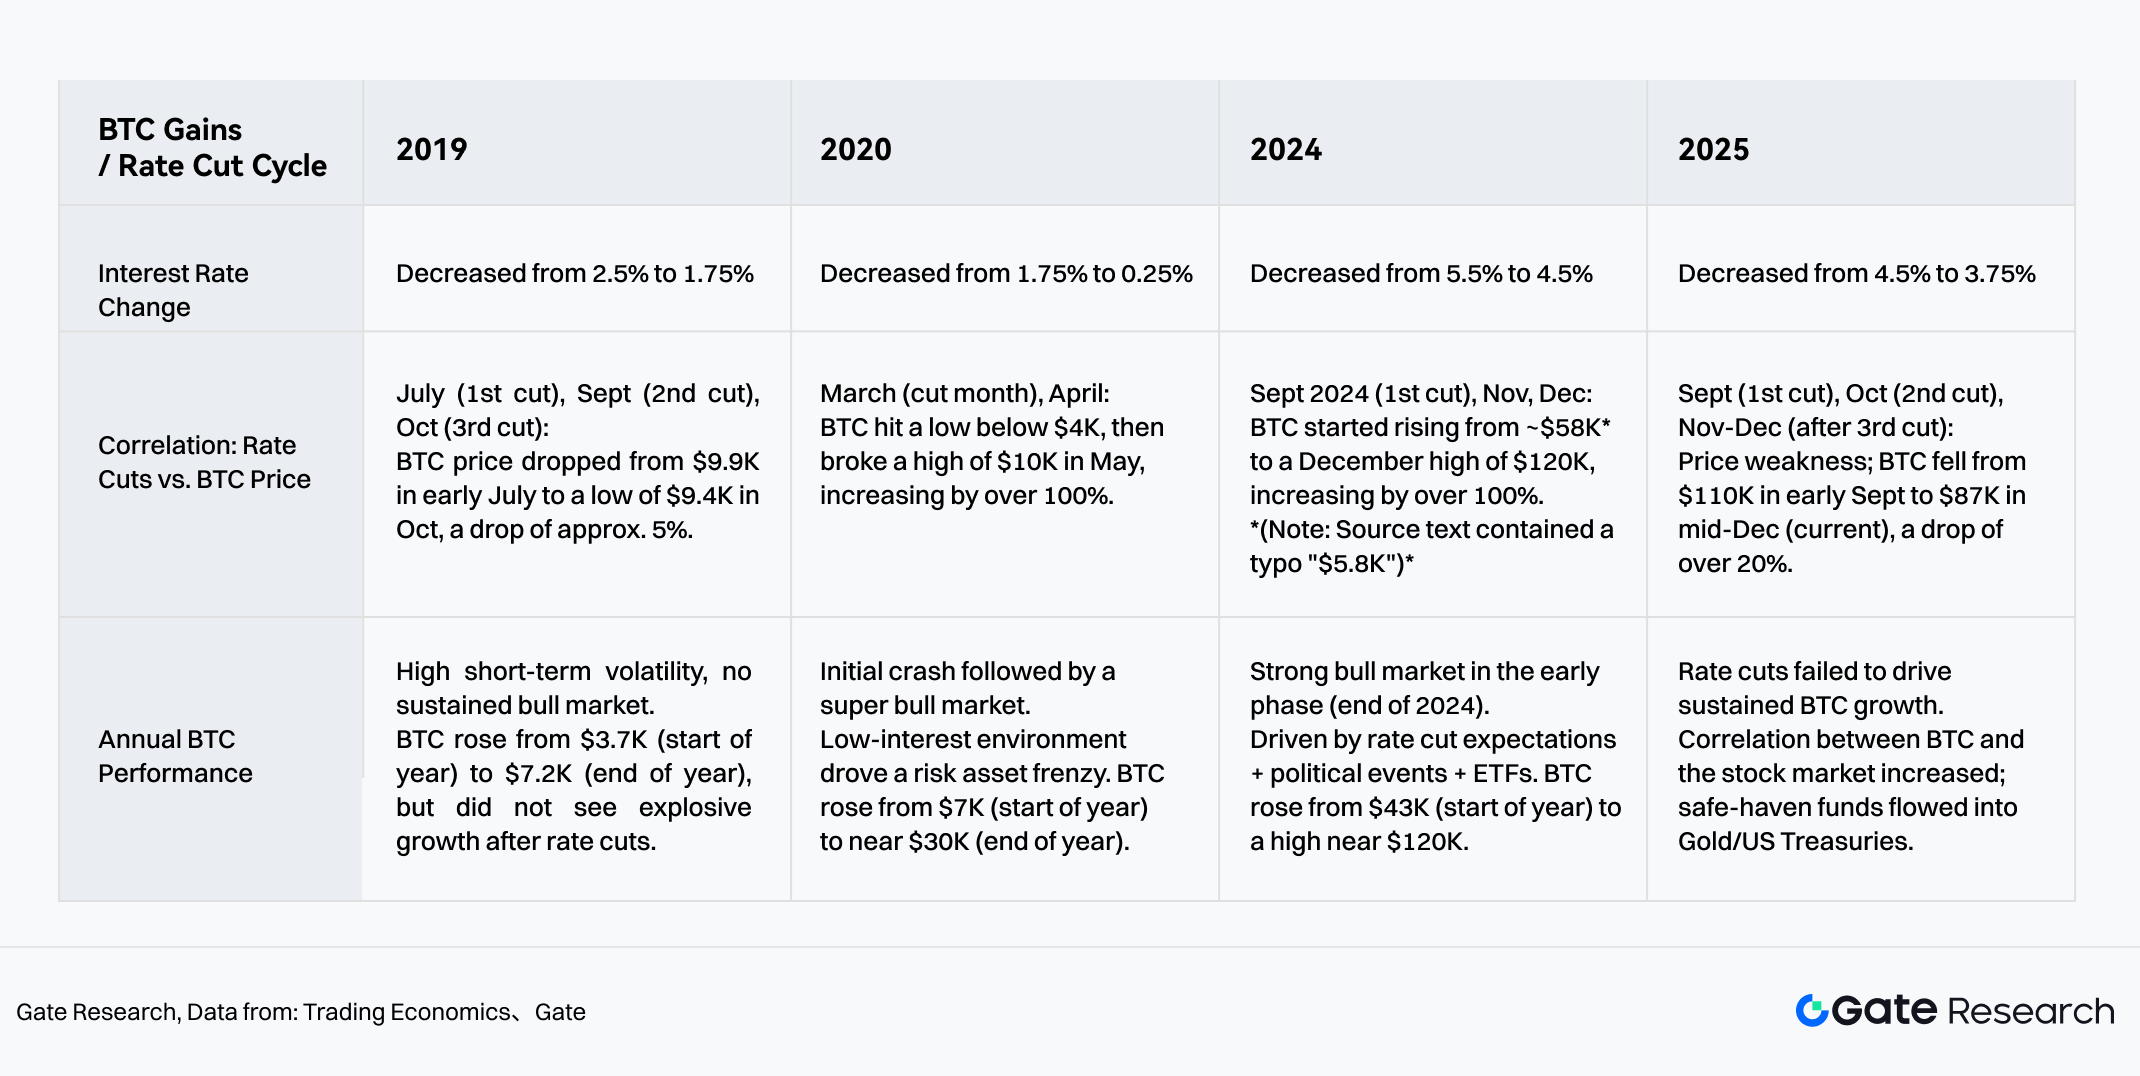
Chart 1: Changes in the Correlation Between Rate Cut Cycles and BTC Over the Past 5 Years
Source From: Gate, Trading Economics
2 Liquidity Structure Reshaping: Pricing Logic and Narrative Divergence Under Institutional Dominance
2.1 Buy-Side Structure: Leapfrog Increase in Institutional Holdings
With the clarification of global regulatory frameworks (such as the US GENIUS Act and EU MiCA implementation) and the maturation of ETF channels, the crypto market is accelerating away from the early stage of disorderly expansion and entering an era of compliant allocation. AIMA’s 2025 survey shows that among 122 institutional investors and hedge fund managers surveyed, the allocation willingness of Traditional Hedge Funds has significantly strengthened—the proportion holding crypto asset exposure climbed from 47% in 2024 to 55% in 2025 (AIMA, 7th Annual Global Crypto Hedge Fund Report, p.7). This data indicates that the clarity of compliant pathways is driving traditional capital from observation to substantial allocation.
Gemini, in its 2025 Crypto Market Review released with Glassnode, clearly pointed out that ETF inflows and outflows are closely related to BTC price trends, with capital inflows exceeding $4B driving prices up by as much as 35%.
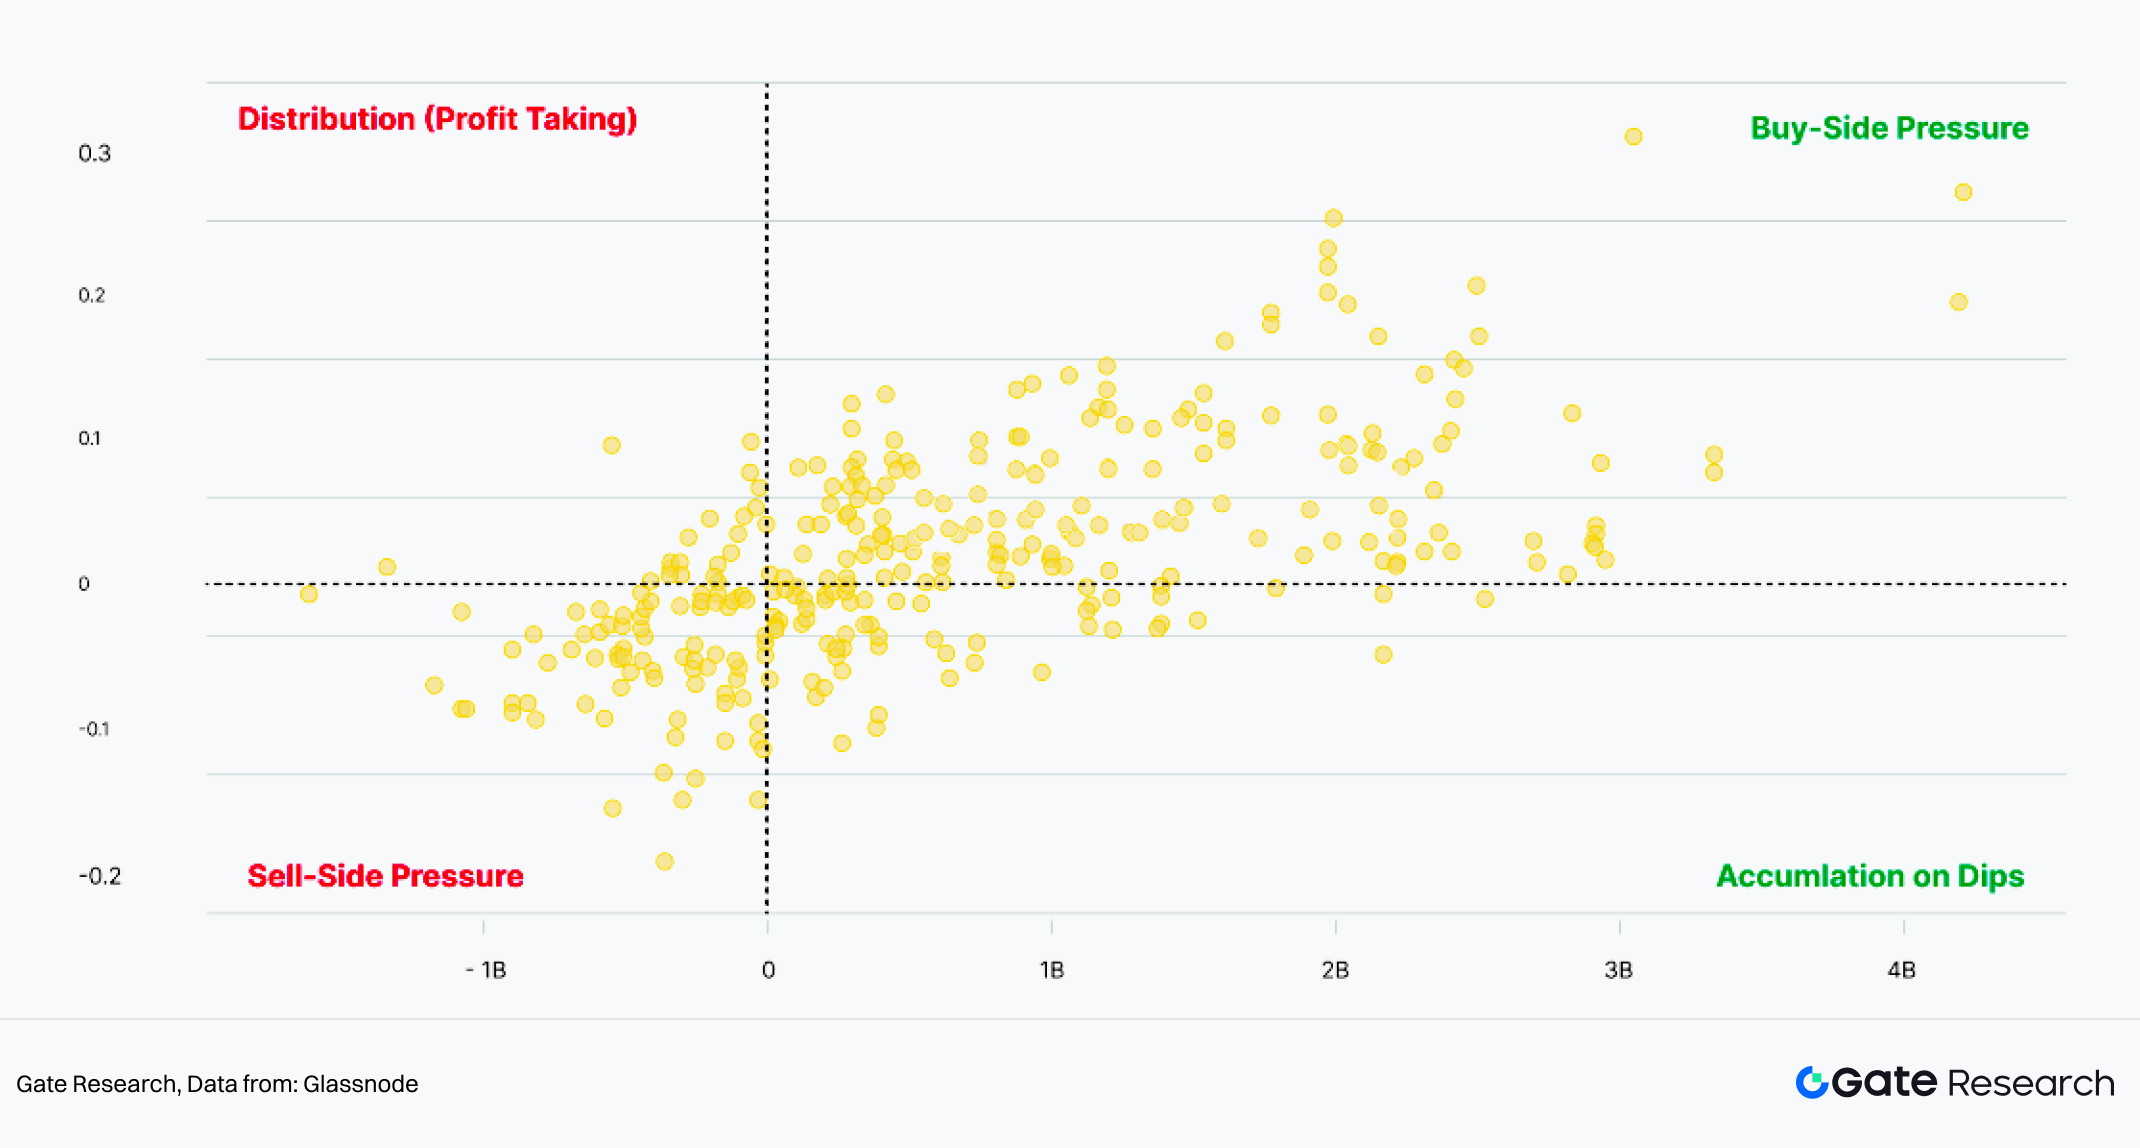
Chart 2: ETF Flows vs Price Performance (7 day)
Source From:Glassnode
2.2 Phase Changes in Macro Logic: Crypto Assets Exhibit Higher Risk Asset Correlation
Correlation Change: With the deep intervention of traditional financial capital, the 6-month correlation between BTC and the Nasdaq Index reached 0.92 in September 2025. The correlation between BTC and the S&P 500 (30-day moving average) surged to 0.5-0.88 in early December 2025, while the correlation with Gold was 0.19. Bitcoin’s correlation level with US stock risk assets is significantly higher than with traditional safe-haven assets (like Gold). This phenomenon indicates that in the current macro environment, crypto asset price performance is closer to High Beta risk asset characteristics rather than stable safe-haven tools.
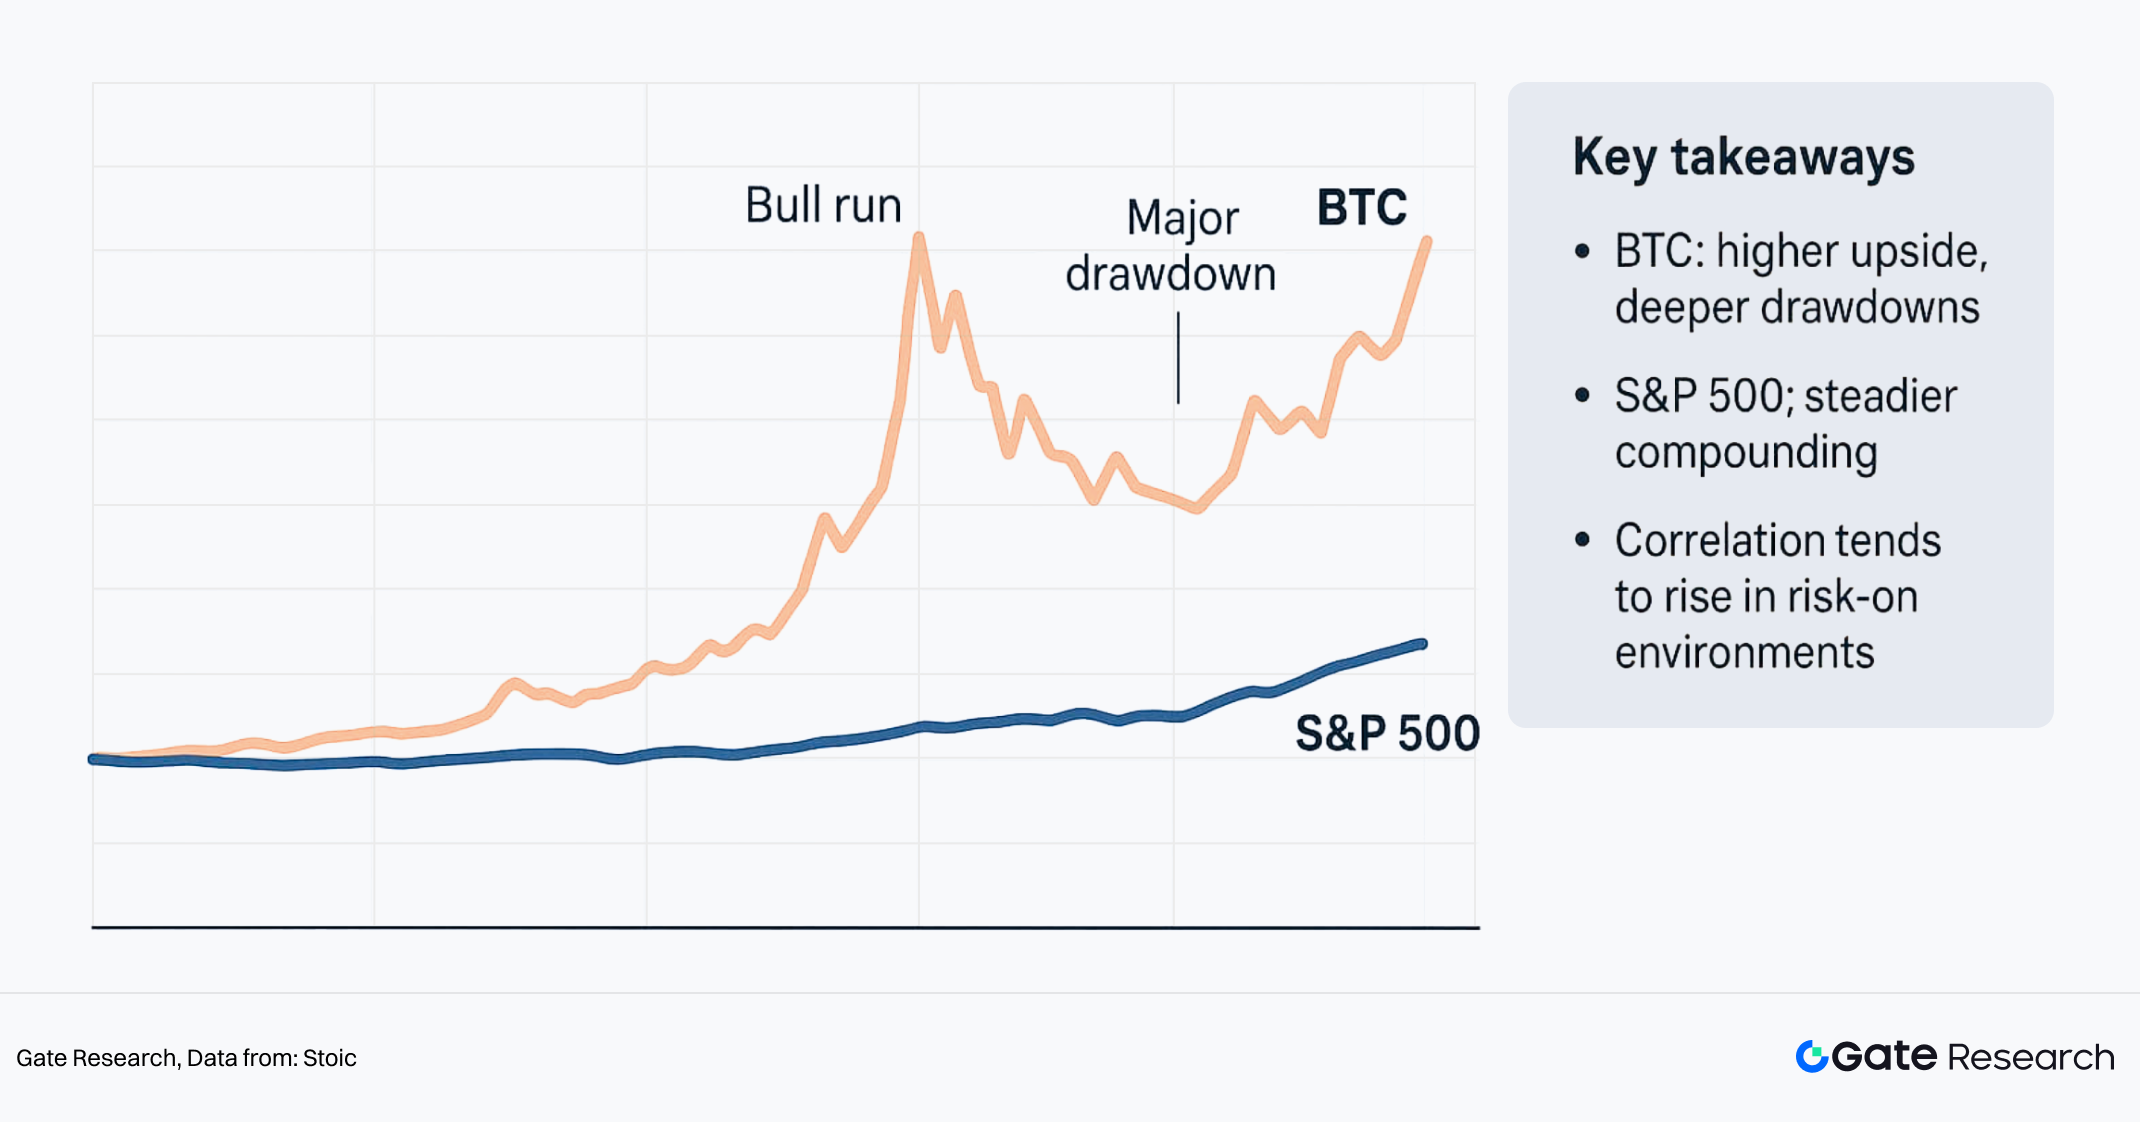
Chart 3: Bitcoin vs S&P 500 performance
Source From:Stoic
2.3 Narrative Divergence: Endogenous Differences in the AI Theme
Although both fall under high-risk assets, the crypto market’s “AI+Web3” narrative and the US stock AI sector show significant resilience differences. The US stock AI rally is driven by technological breakthroughs and corporate earnings (e.g., Nvidia financial reports), supported by solid fundamentals; whereas the crypto market’s AI narrative remains mostly at the proof-of-concept stage, lacking substantial productivity conversion and defined business models. In a macro liquidity contraction cycle, crypto AI projects lacking earnings support struggle to attract certainty-focused institutional funds, causing their performance to lag far behind the Nasdaq Index.
3 Incremental Logic and Emerging Sectors: New Reservoirs for Liquidity
3.1 Liquidity Stratification in Macro Context: Zero-Sum Game vs. Incremental Influx
Regarding the status quo, it must be emphasized that policy rate cuts do not equal comprehensive easing of financial conditions. Under the influence of fiscal deficits, credit risk premiums, and regulatory constraints, the incremental liquidity actually available for allocation to risk assets remains limited. Simultaneously, the sedimentation logic of on-chain funds across the network has changed.
As of November 20, 2025, the annual growth rate of network-wide TVL was only +4.40% (significantly slowing down from +120.3% in 2024), marking the market’s entry into a stock-game (zero-sum) stage. However, beneath the surface of overall liquidity scarcity in the cryptocurrency industry, the RWA/Stablecoin sector carved out an independent “alpha” trend.
- Counter-Trend High Growth:The RWA/Stablecoin sector recorded a 133% TVL growth rate in 2025, making it the fastest-growing sector in the market, in sharp contrast to the contraction of Dexs (-21%) and Bridges (-19%).
- Capital Reservoir: From the perspective of Net Inflow, although Lending topped the list with $16B (mainly driven by leverage demand from existing funds), the RWA sector ranked second with a net inflow scale of $9.42B. This indicates that RWA has replaced pure DeFi protocols as the preferred “anchor point” for external incremental funds entering the crypto market.
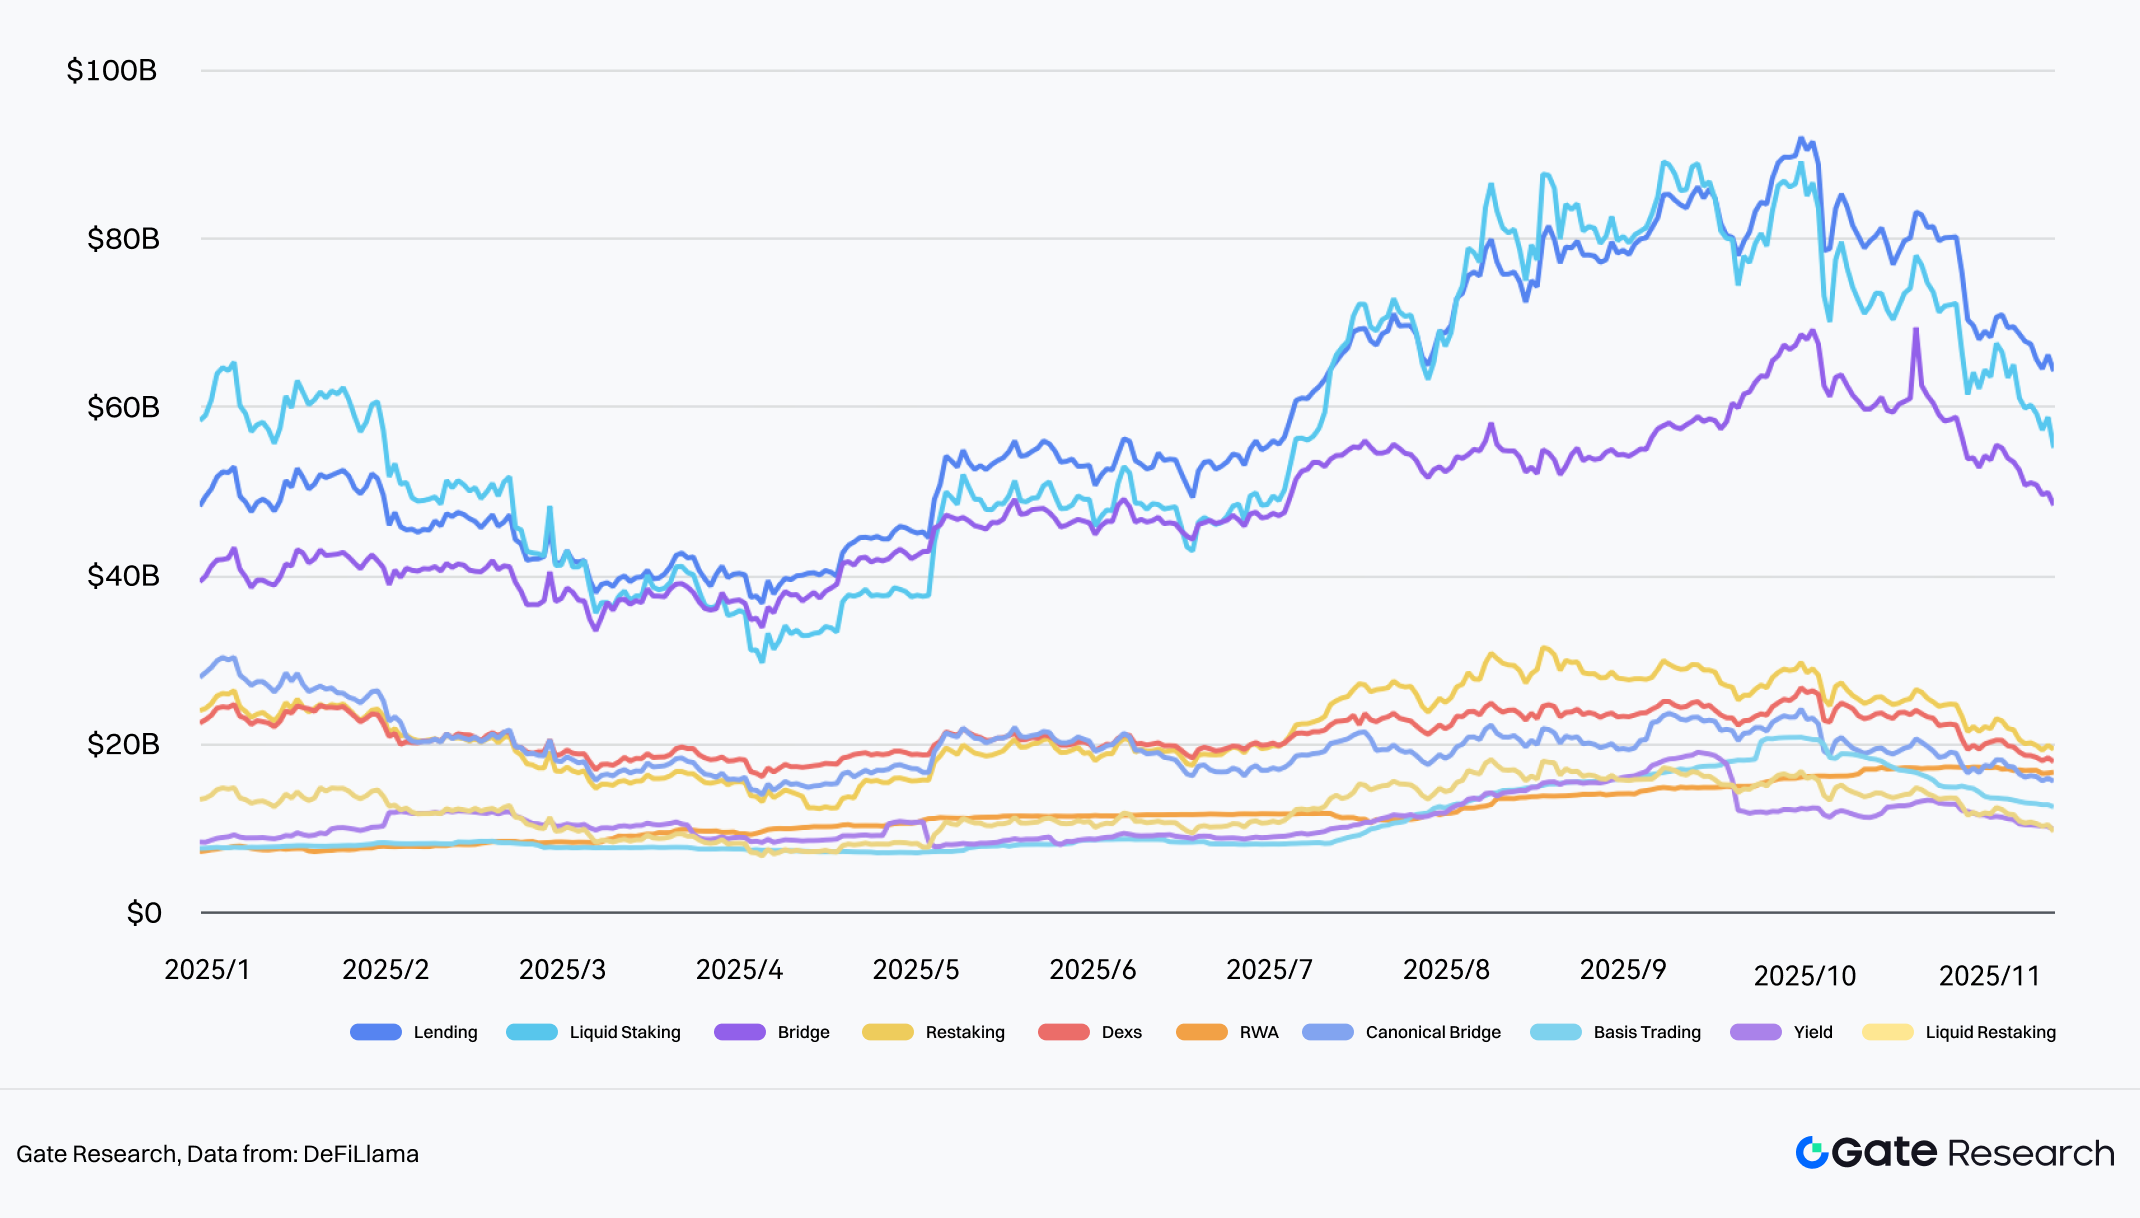
Chart 4: Top 10 Track Liquidity TVL Changes & Net Inflows
Source From:DeFiLlama
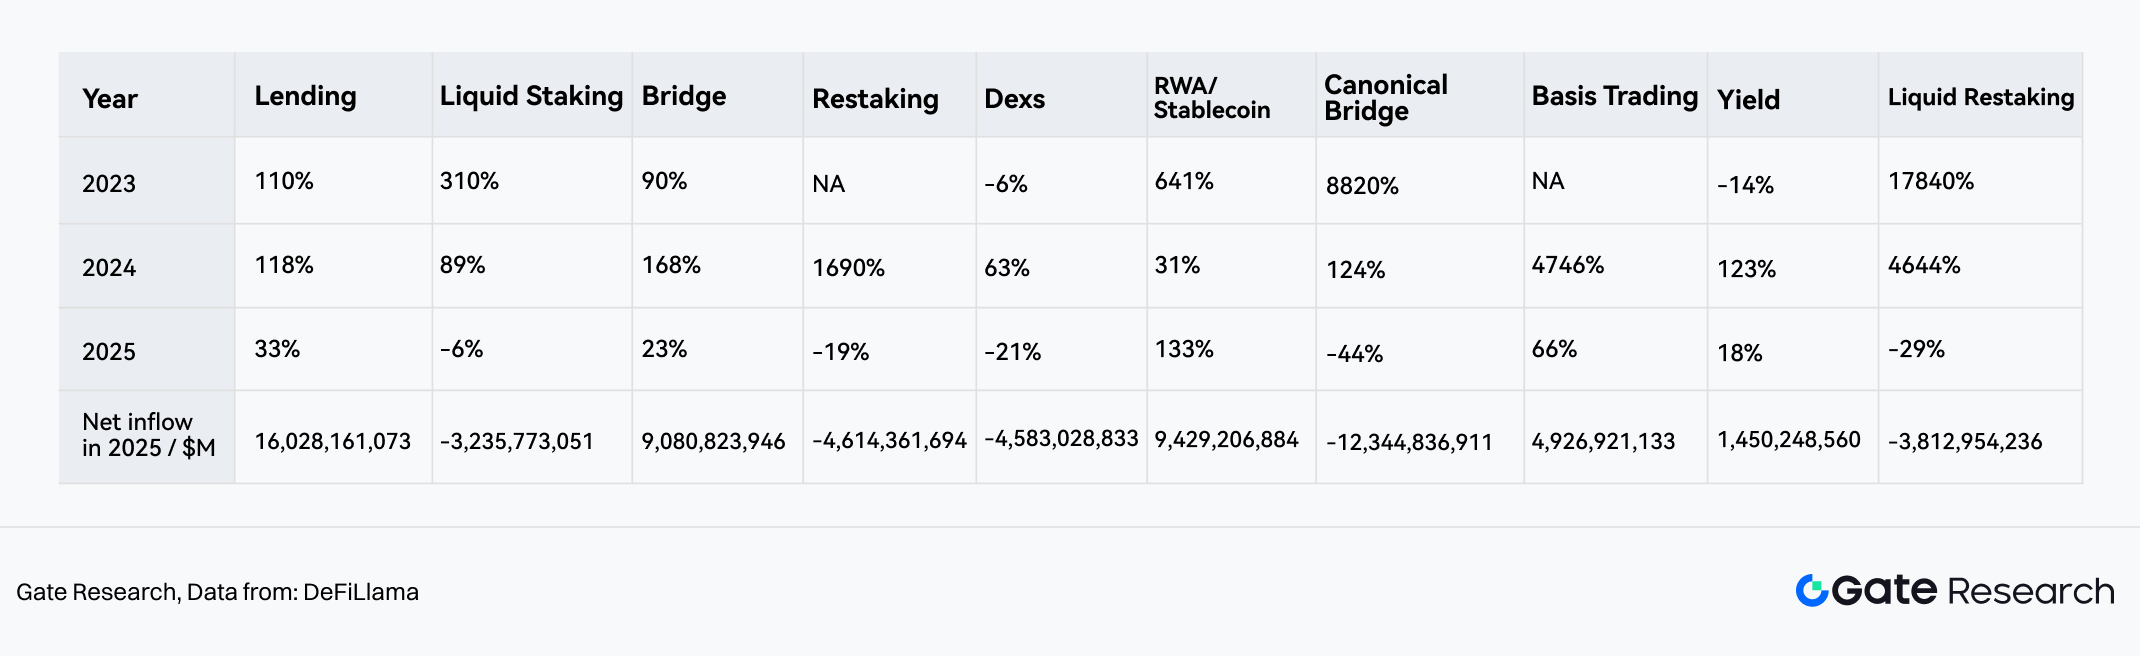
Chart 5: Top 10 Track Liquidity TVL Changes from 2023 to 2025(From left to right, sorted by TVL absolute value from highest to lowest)
Source From:DeFiLlama
3.2 Scenario Reconstruction: From “Medium of Exchange” to “PayFi” Infrastructure
According to the BCG consulting report Stablecoins: Five killer tests to gauge their potential, the total transaction volume of stablecoins reached $26.1T in 2024-2025. Although “Crypto Asset Trading Settlement” still dominates with 92%, the fastest marginal growth comes from the integration with the real world in two categories:
- Payments: Share rose to 5-6% (approx. $1.3T), marking the transition of stablecoins from speculative tools to a global payment network.
RWA/Treasuries (Tokenized Assets): Share is 3%, representing the rigid demand of on-chain capital for the Risk-free Rate of US Treasuries.
The formation of these three pillars (Trading, Payments, RWA) means stablecoins have bridged the loop between B-side institutional settlement and C-side real consumption.
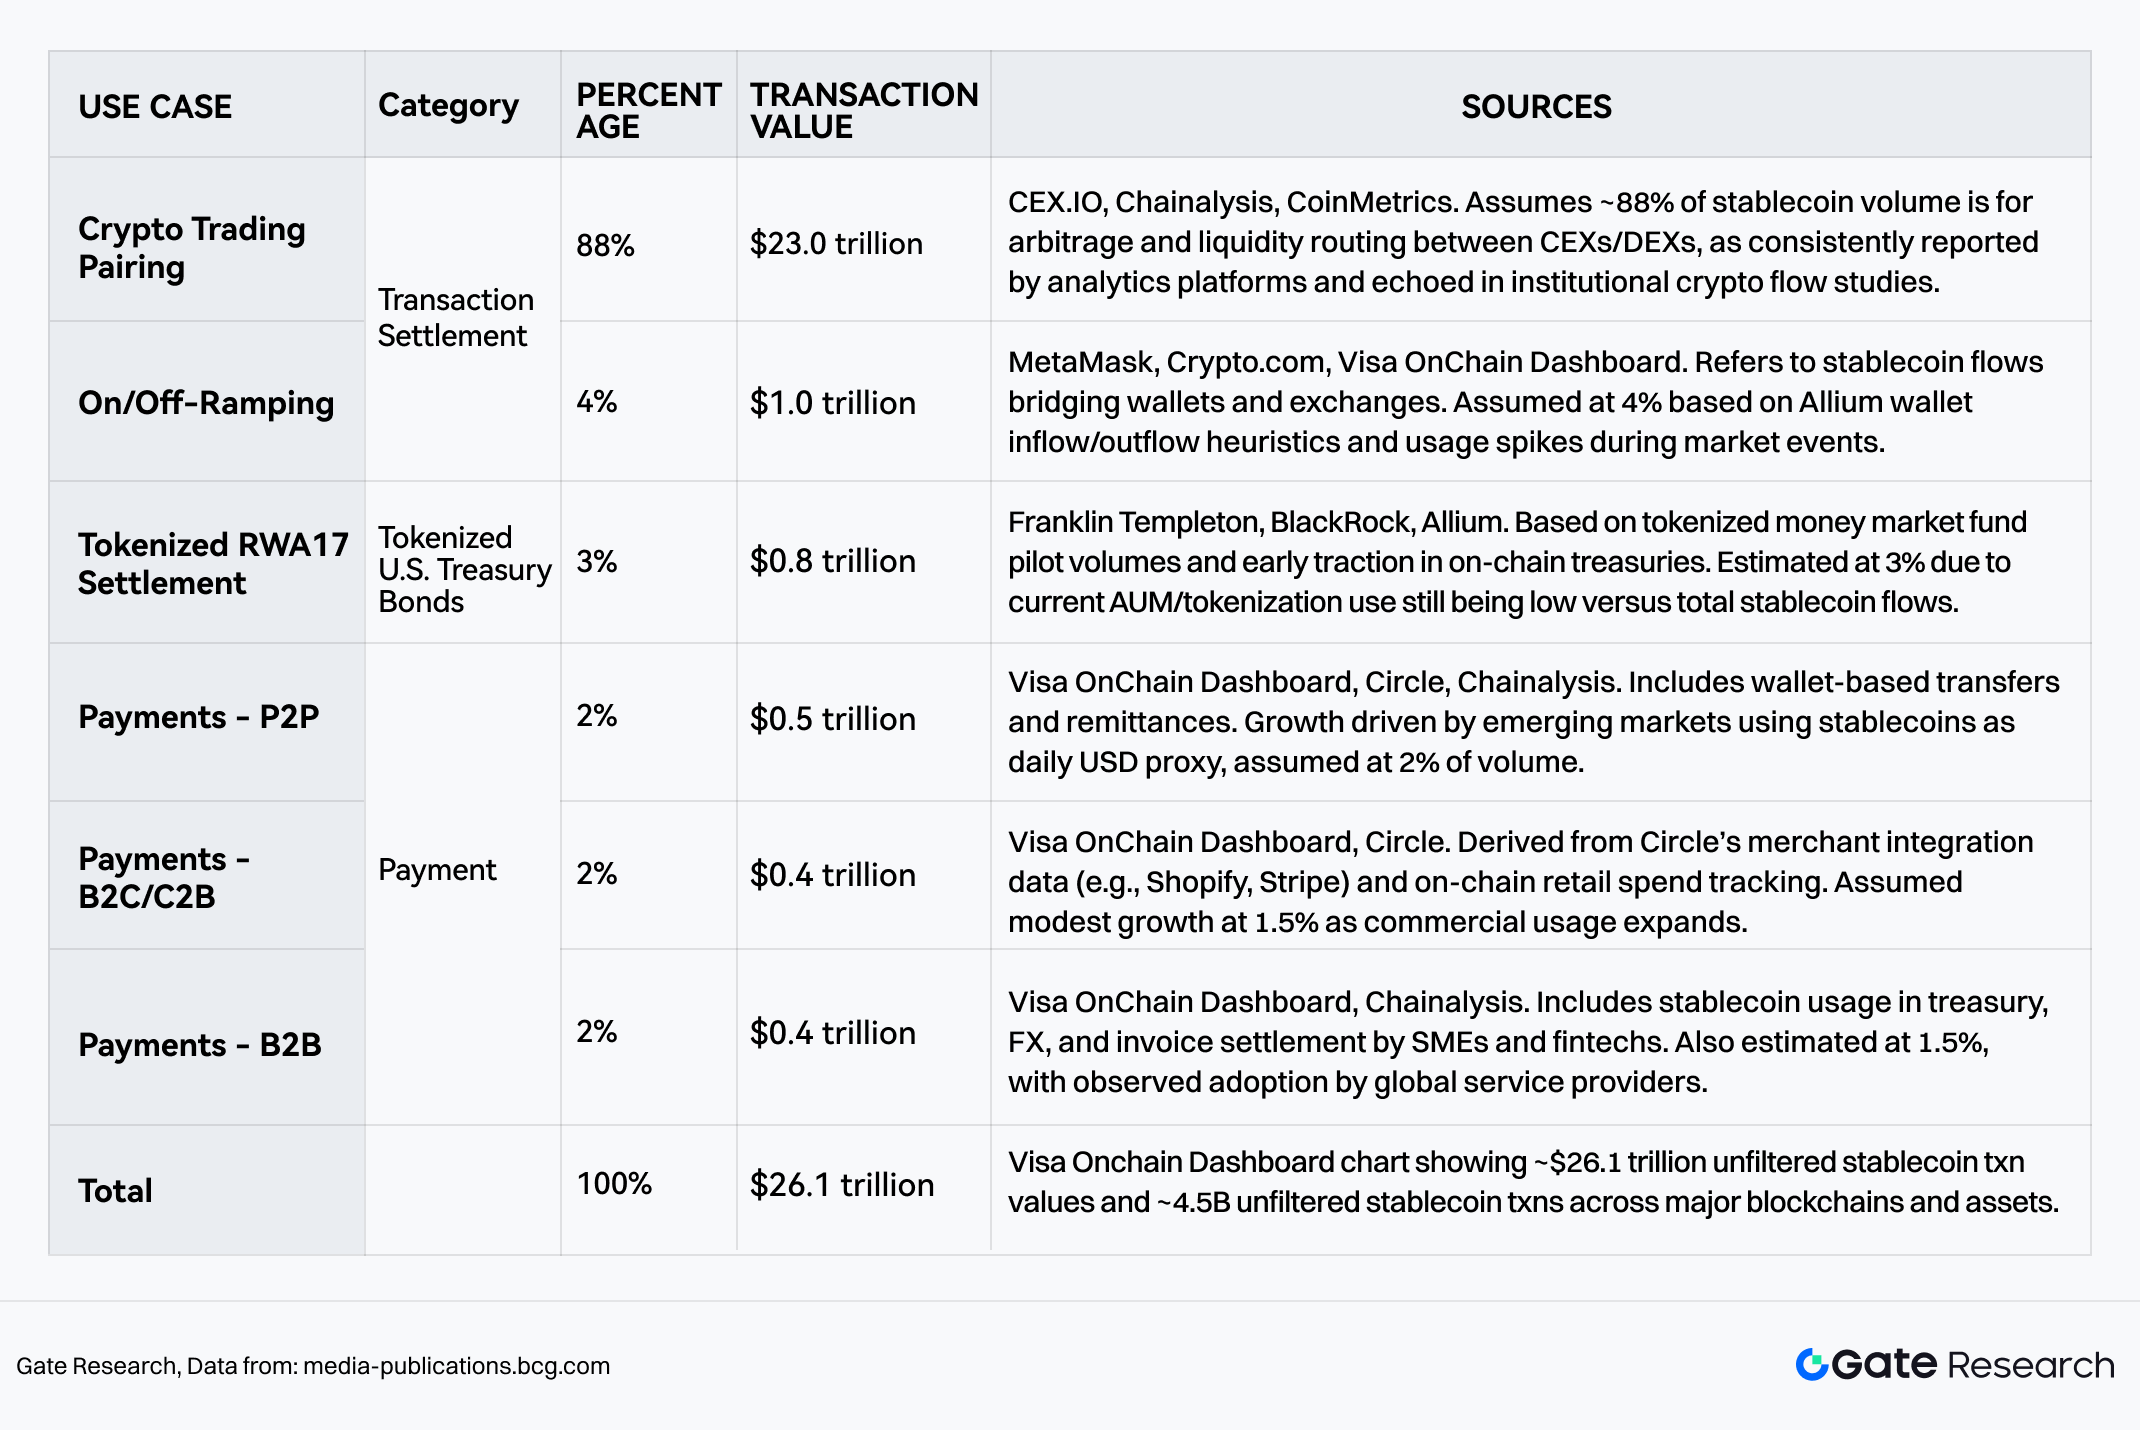
Chart 6: 2024-2025 Stablecoin Transaction Value and Transaction Count Breakdown
Source From:BCG
3.3 Micro Insights into the Payment Sector: Institutional Dominance and On-Chain Stratification
Stablecoin payments are reshaping the global clearing system. Ernst & Young (EY) predicts that by 2030, stablecoins will carry 5%-10% of global payment traffic. Artemis data further reveals the current growth structure: cumulative payment settlement volume reached $136B in 2023-2025, with B2B and institutional card businesses accounting for an absolute share of 80%, becoming the core engine driving this growth. With the completion of landmark events such as Stripe acquiring Bridge, institutional payments have formally moved from “on-chain experiments” to “commercial normalcy.”
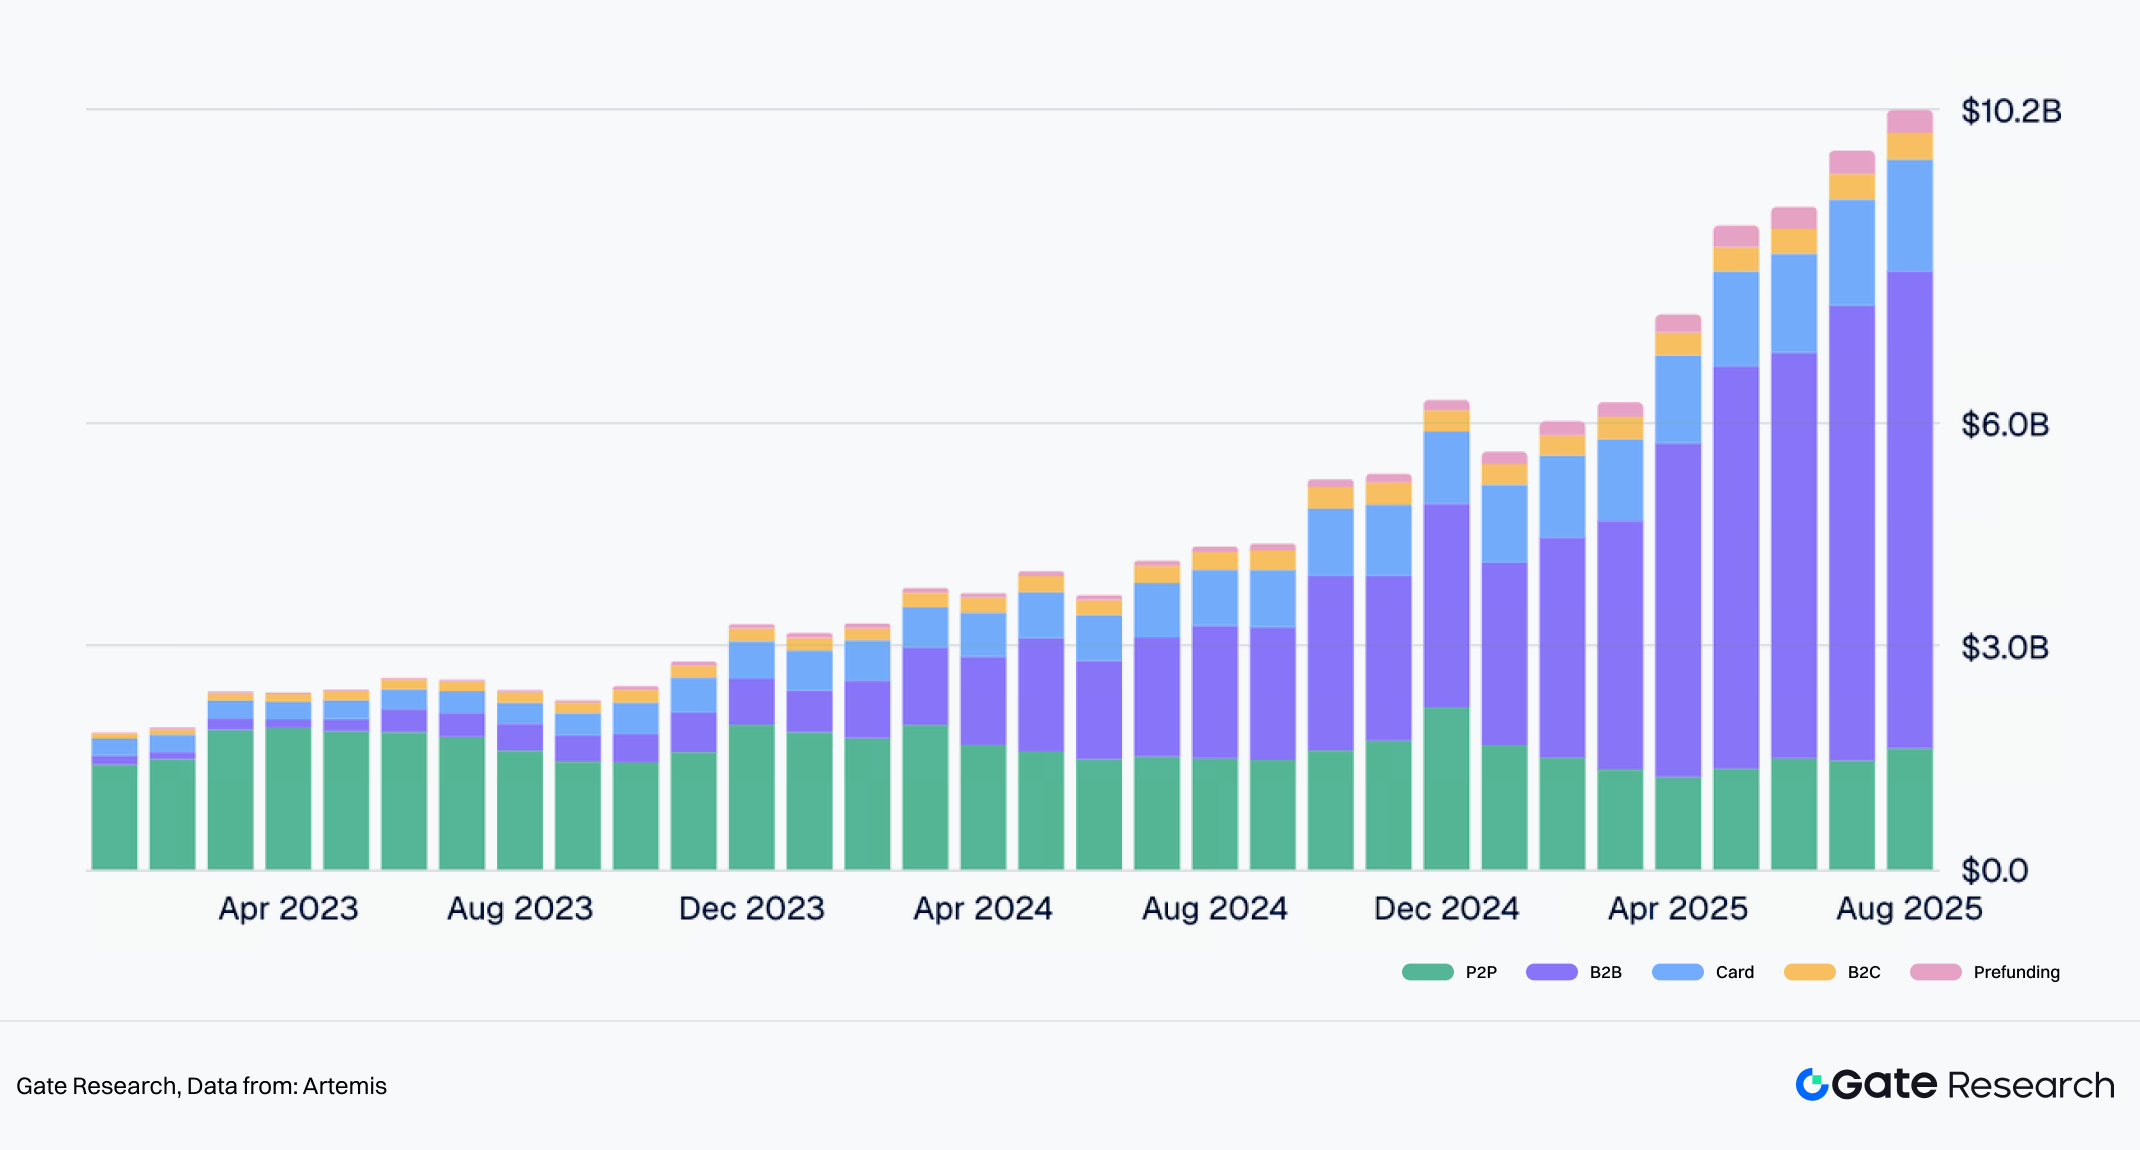
Chart 7: Changes in stablecoin payment types from 2023 to 2025
Source From:Artemis
Artemis data shows that stablecoin payments exhibit clear “dual-track” characteristics:
- B2B Large Value Settlement (Tron & Ethereum):
- Growth Trend: Monthly transaction volume surged from less than $100M in early 2023 to $6B+ in mid-2025.
- Chain Preference: Institutional large transfers significantly prefer Ethereum and Tron networks with deep liquidity and high security, with an average transaction value exceeding $219,000. This reflects that in commercial settlement scenarios, fund security and network consensus take priority over low Gas fees.
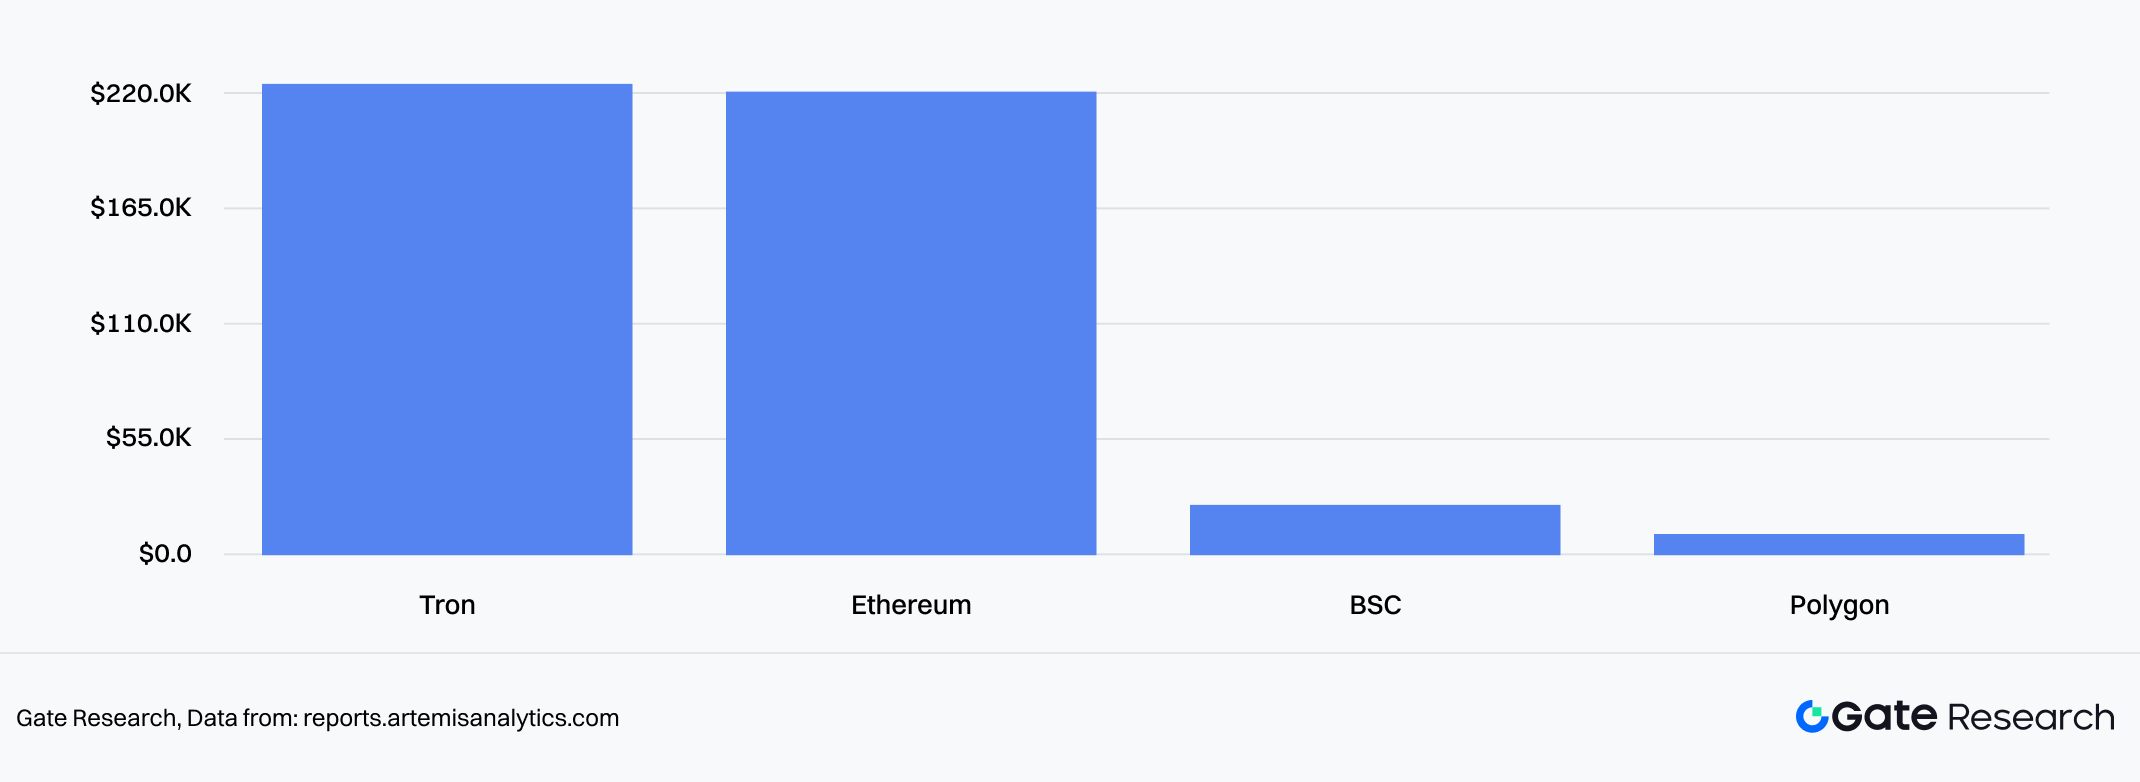
Chart 8: Average B2B Transaction Size by Blockchian
Source From:Artemis
- C-Side Consumer Payments (Card & High Frequency):
- Growth Trend: Monthly transaction volume for Crypto Cards bound to stablecoins broke $1.5B.
- Chain Preference: Primarily small, high-frequency penetration of the US credit card system on Ethereum L2 and high-performance chains (like BSC/Polygon), with an average single transaction of $40-$90, covering daily consumption scenarios.
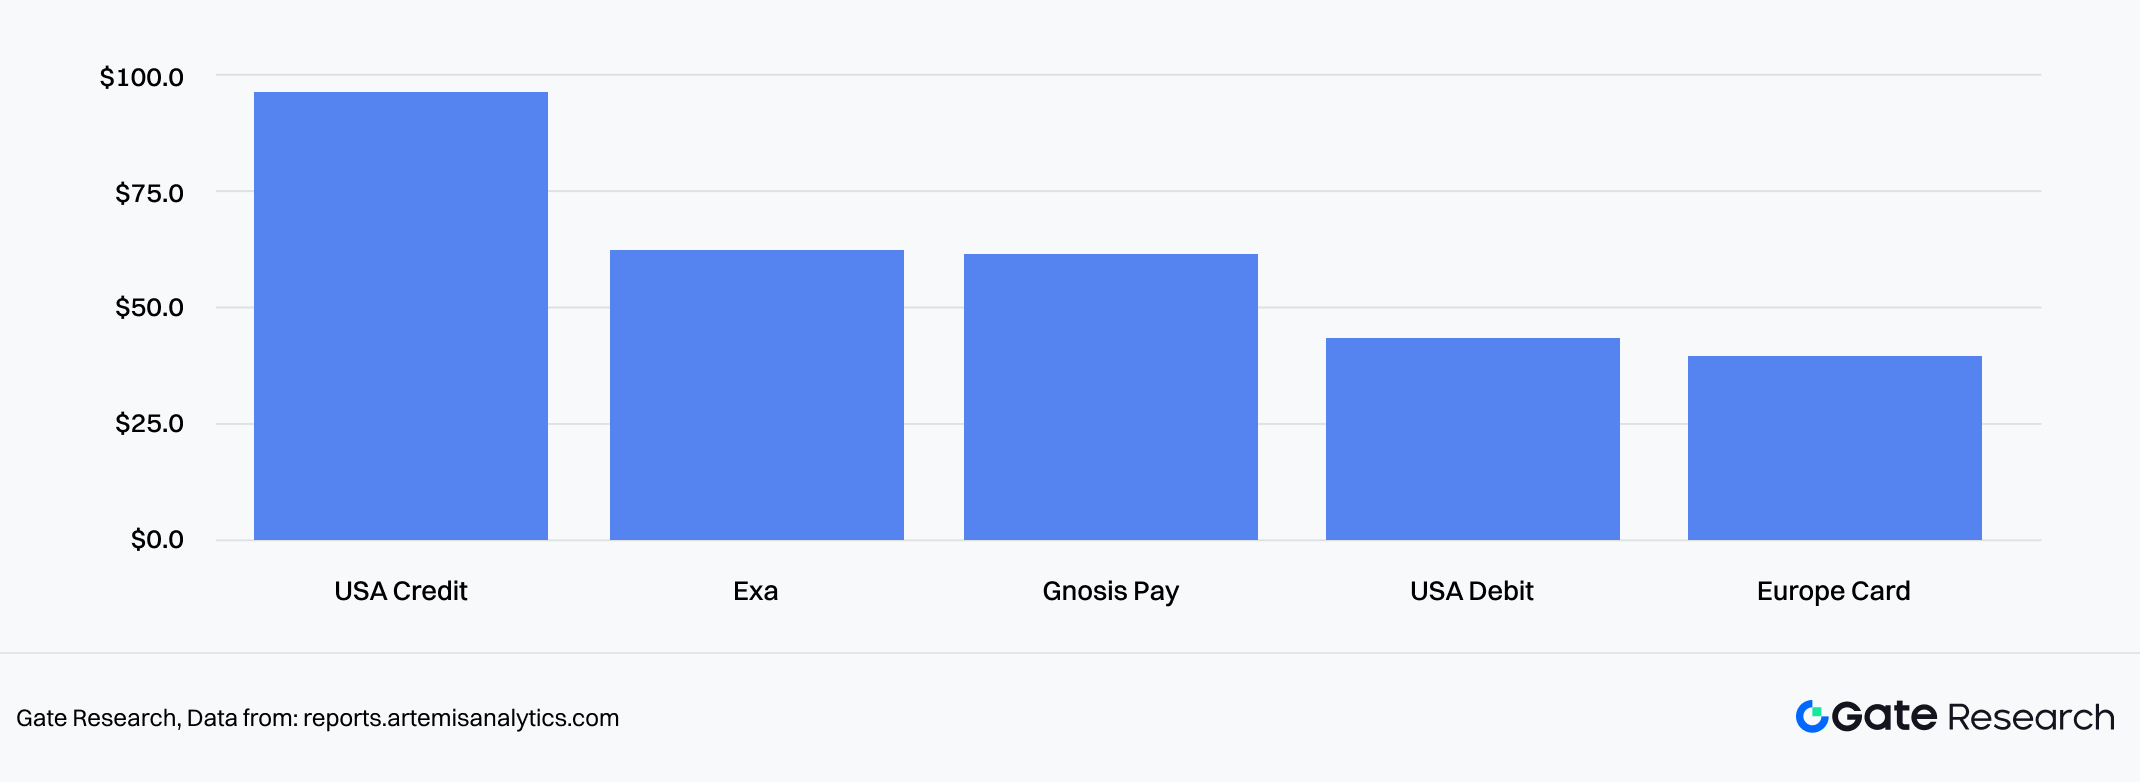
Chart 9: Average Card Transaction Size by Card Type
Source From:Artemis
3.4 Competitive Landscape: The Game of Compliance and Yield
In 2025, the dimension of competition in the stablecoin market has upgraded from a singular “battle for liquidity” to a multi-dimensional game of “Compliance” and “Yield-bearing Capabilities.” The total scale steadily climbed from $200B at the beginning of the year to $300B+, presenting a “Let a Hundred Flowers Bloom” landscape:
- Giant’s Moat: USDT continues to maintain growth with a 47.5% market share, but its dominance faces challenges.
- Compliance New Forces: Benefiting from Circle’s IPO plan and favorable policies, USDC continues to grow steadily with a 34% market share; PayPal’s PYUSD is rapidly penetrating traditional financial channels with a 270% growth rate.
- Yield-bearing Innovation: USDe (neutral arbitrage strategy) and BUIDL (BlackRock Treasury Fund) achieved explosive growth of 66.9% and 623% respectively. This indicates that before the rate cut cycle began, the market was extremely hungry for “on-chain yield-bearing assets.”
- Future Outlook: With the advancement of the US GENIUS Act and the entry of traditional asset management giants like Fidelity, stablecoins will no longer be limited to fiat channels but will evolve into a global foundational currency layer with “multi-chain interoperability” and “endogenous yield.”
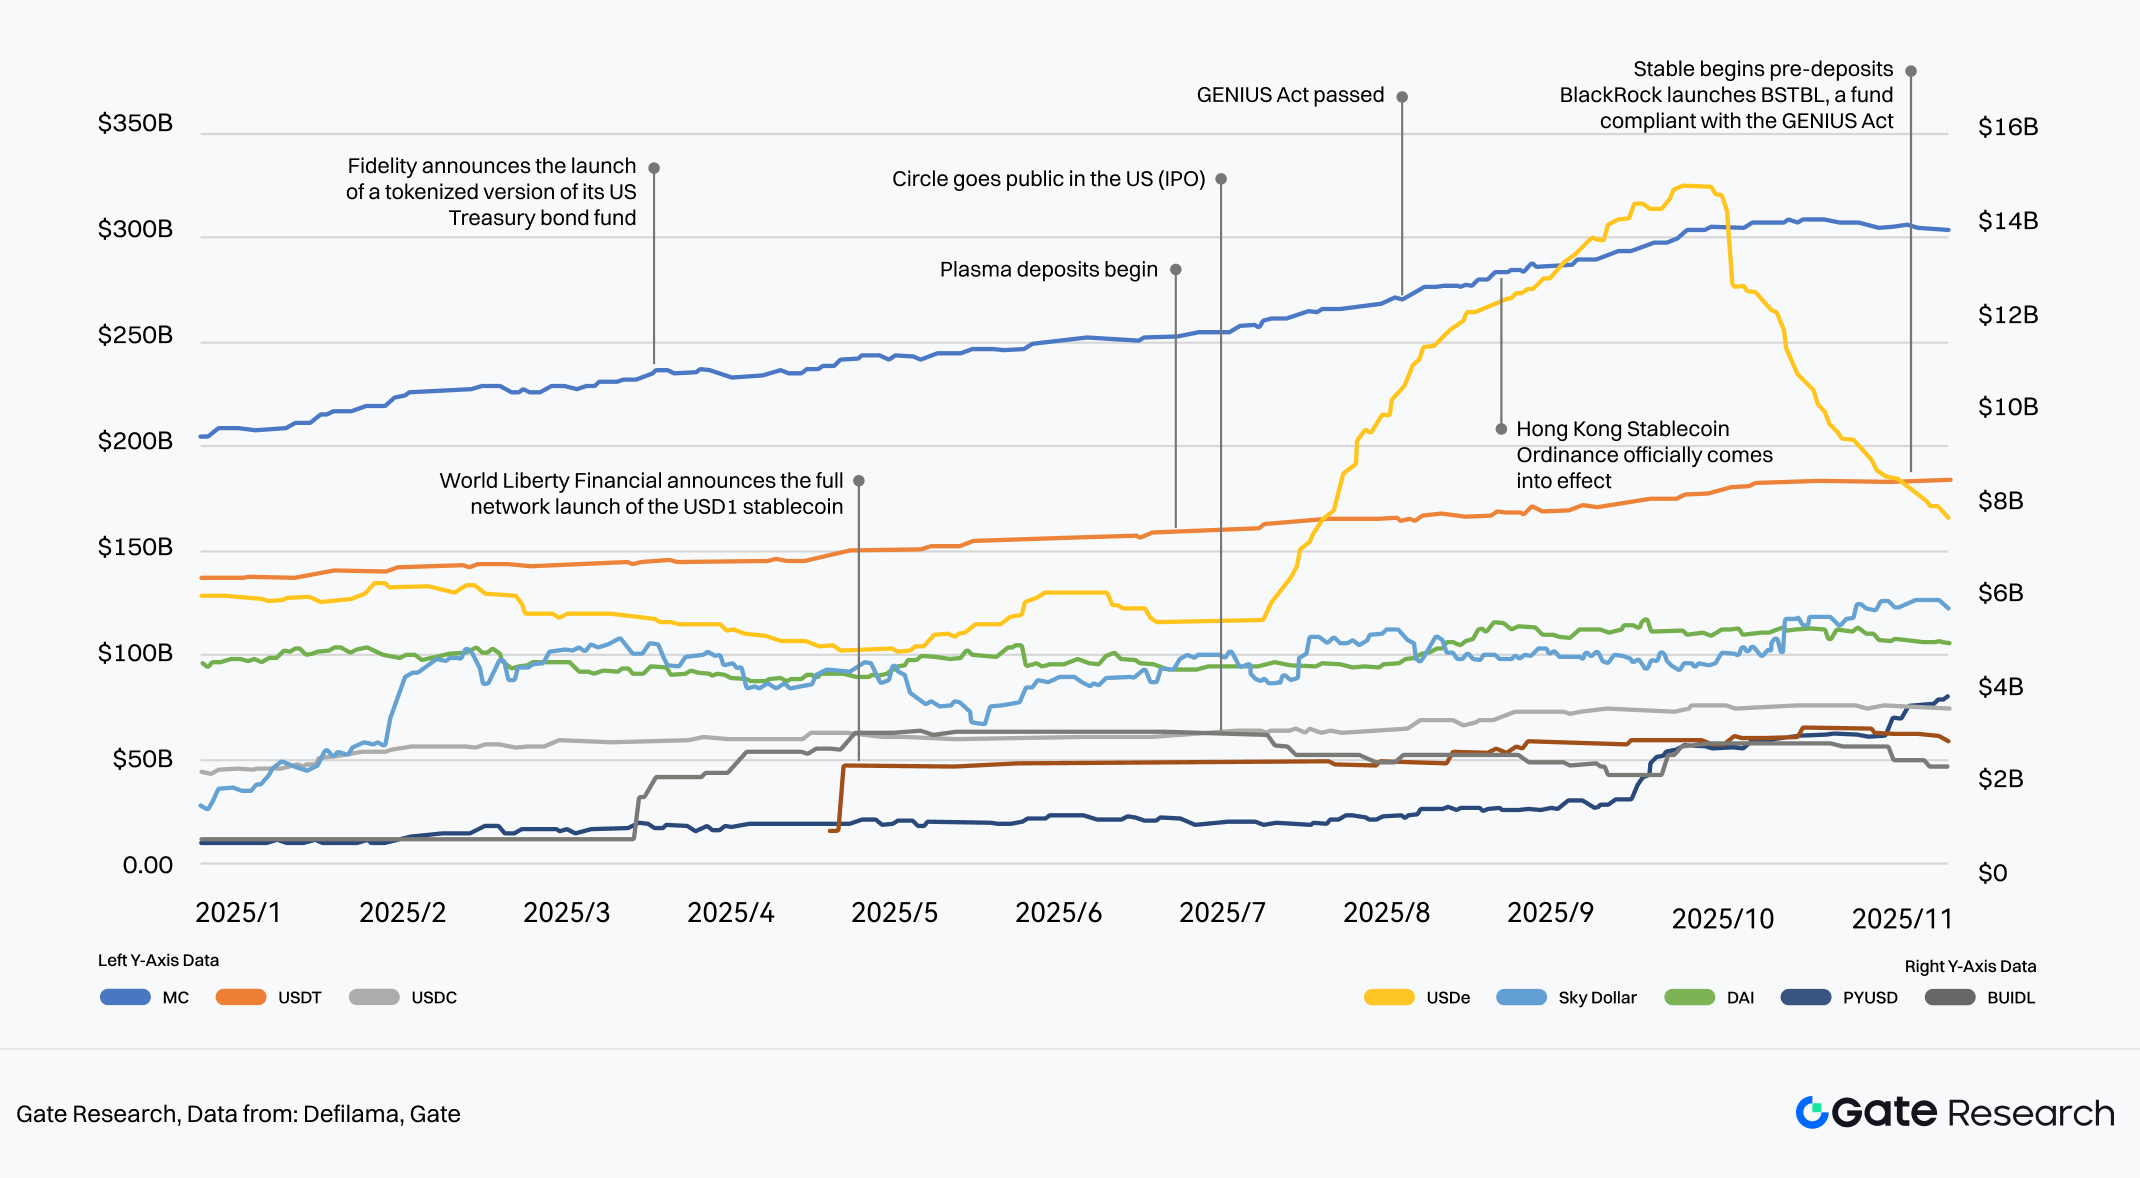
Chart 10: Growth of mainstream stablecoins in 2025
Source From:DeFiLlama, Gate
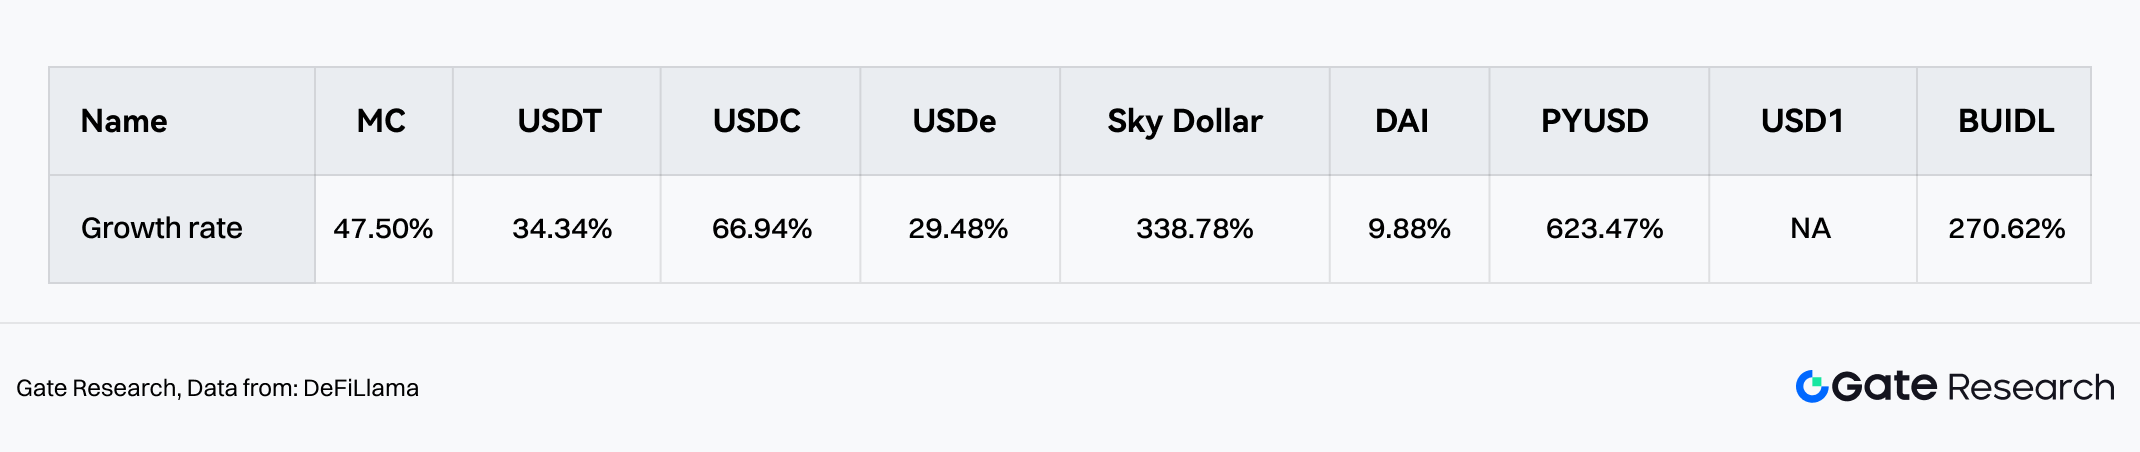
Chart 11: Growth rate of stablecoin scale in 2025
Source From:DeFiLlama
II. Primary Market: Capital Flow Hysteresis and “Liquidity-Led Remodeling”
1. Financing Rhythm: From “Chasing Price” to “Confirming Macro”
In 2025, primary market investment amounts and market capitalization levels fluctuated, showing significant Decoupling and Hysteresis characteristics.
- Weak Correlation: VC investment activity did not stay synchronized with BTC price trends. During the period when BTC hit new highs in Q2-Q3, primary market financing did not significantly expand (Q2 $2.25B / Q3 $3.12B), reflecting the risk-averse tendency of institutional capital under macro uncertainty.
- Certainty Premium: Large-scale capital return occurred after the macro “boot dropped.” As rate cut expectations became clear, financing in October alone surged to $3.6B, exceeding the total sum of Q2 or Q3. This data indicates that the core decision factor in the primary market shifted from simple “Secondary Price FOMO” to the confirmation of “Macro Certainty” and “Regulatory Clarity.”
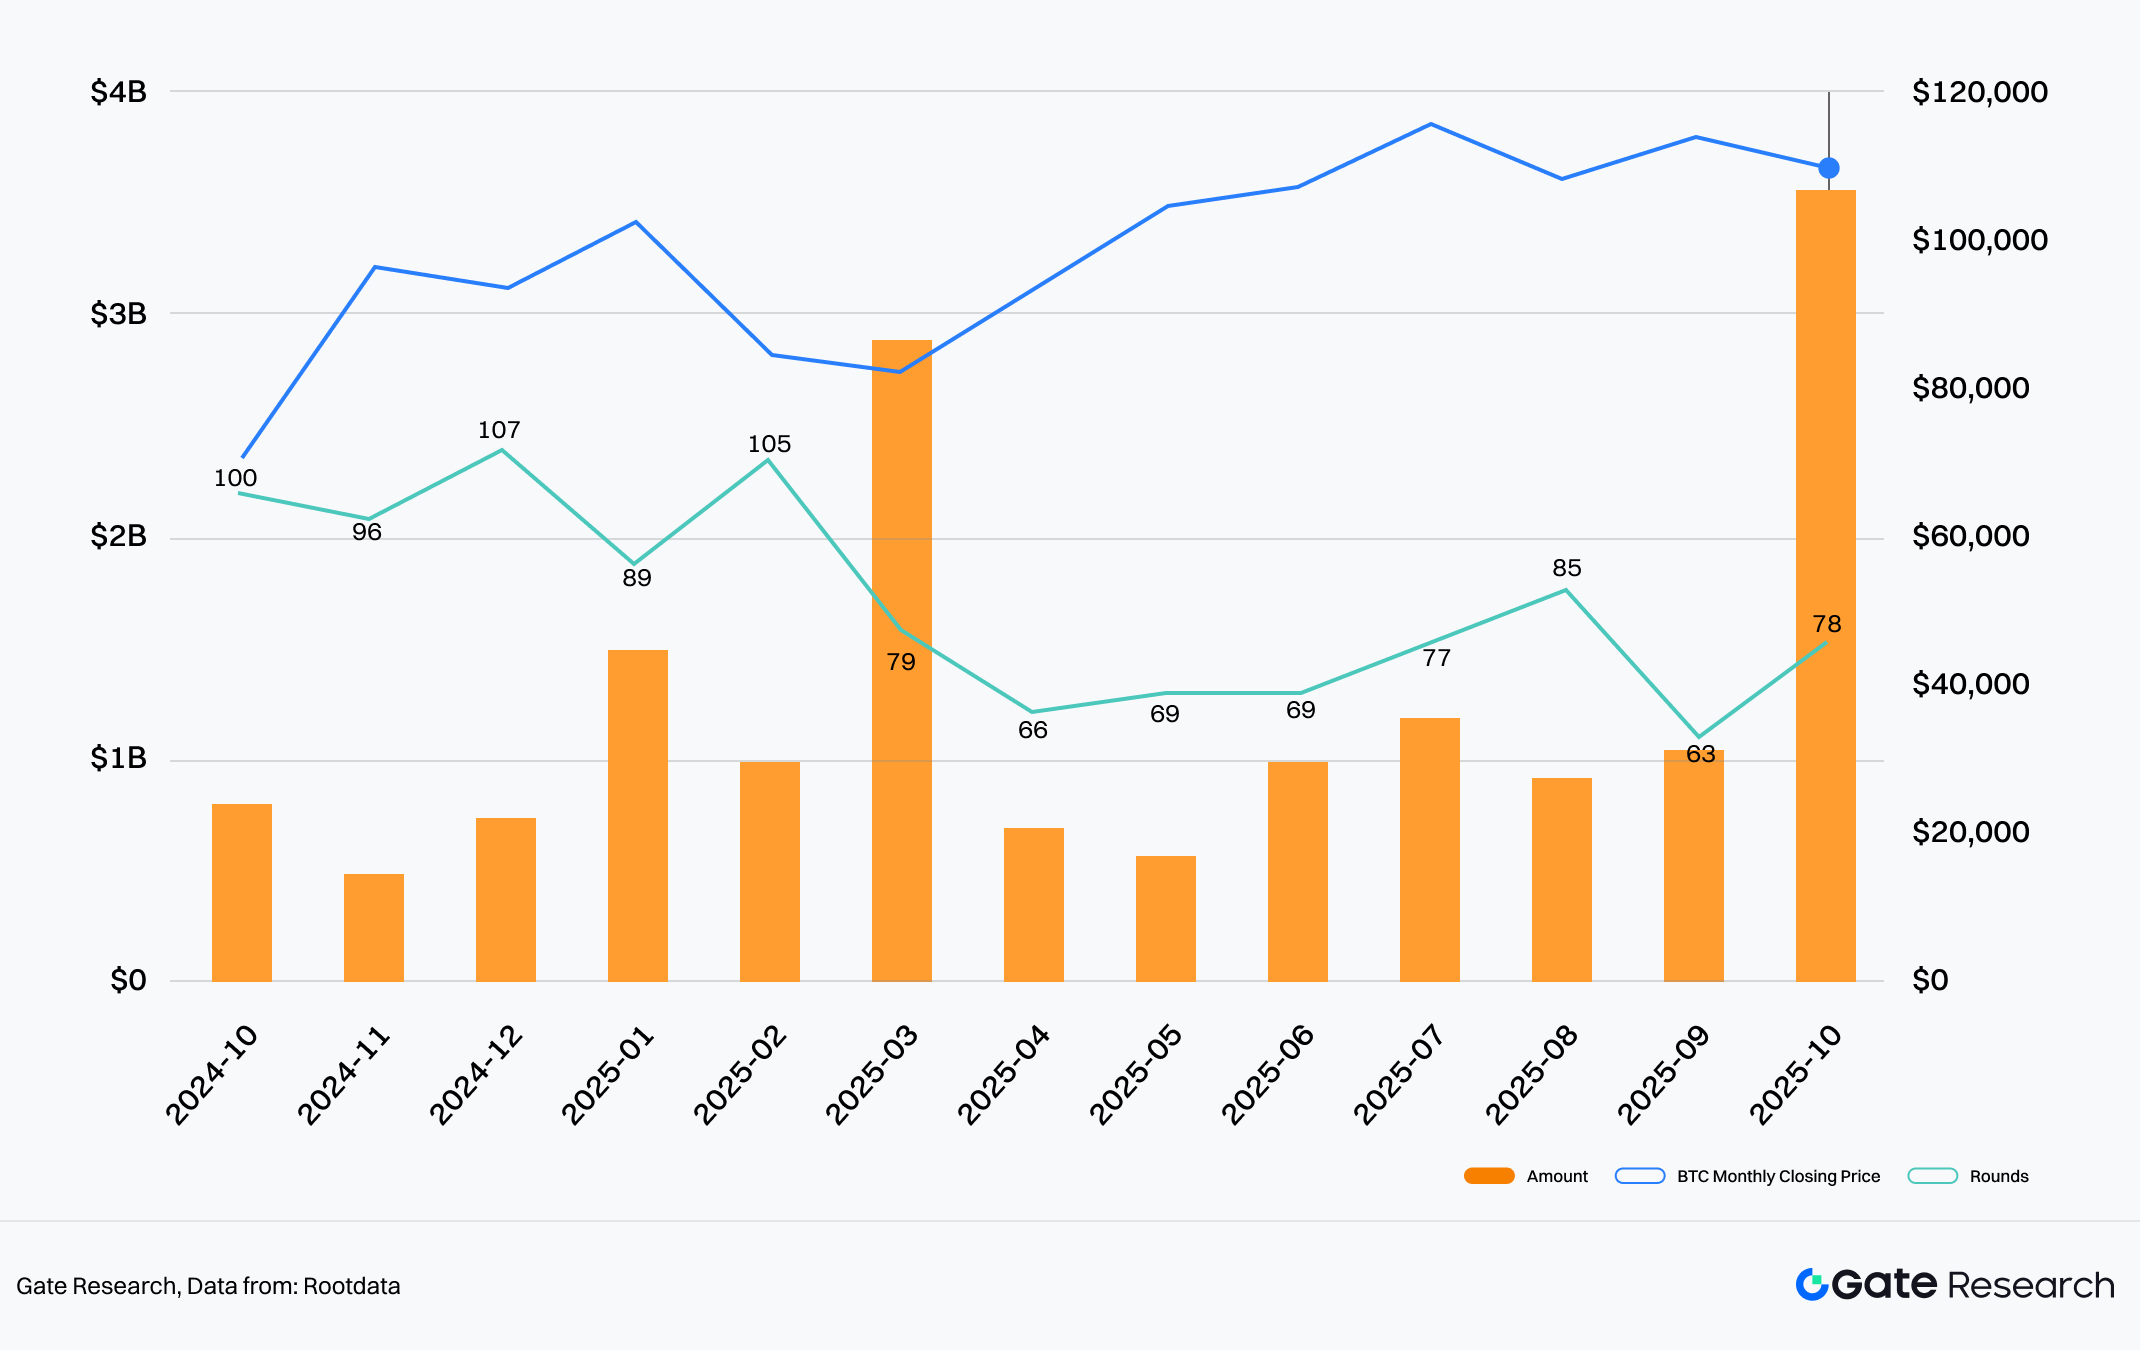
Chart 12: Monthly Analysis: Crypto Market Funding Size, Rounds, and Bitcoin Price Changes
Source From: Rootdata
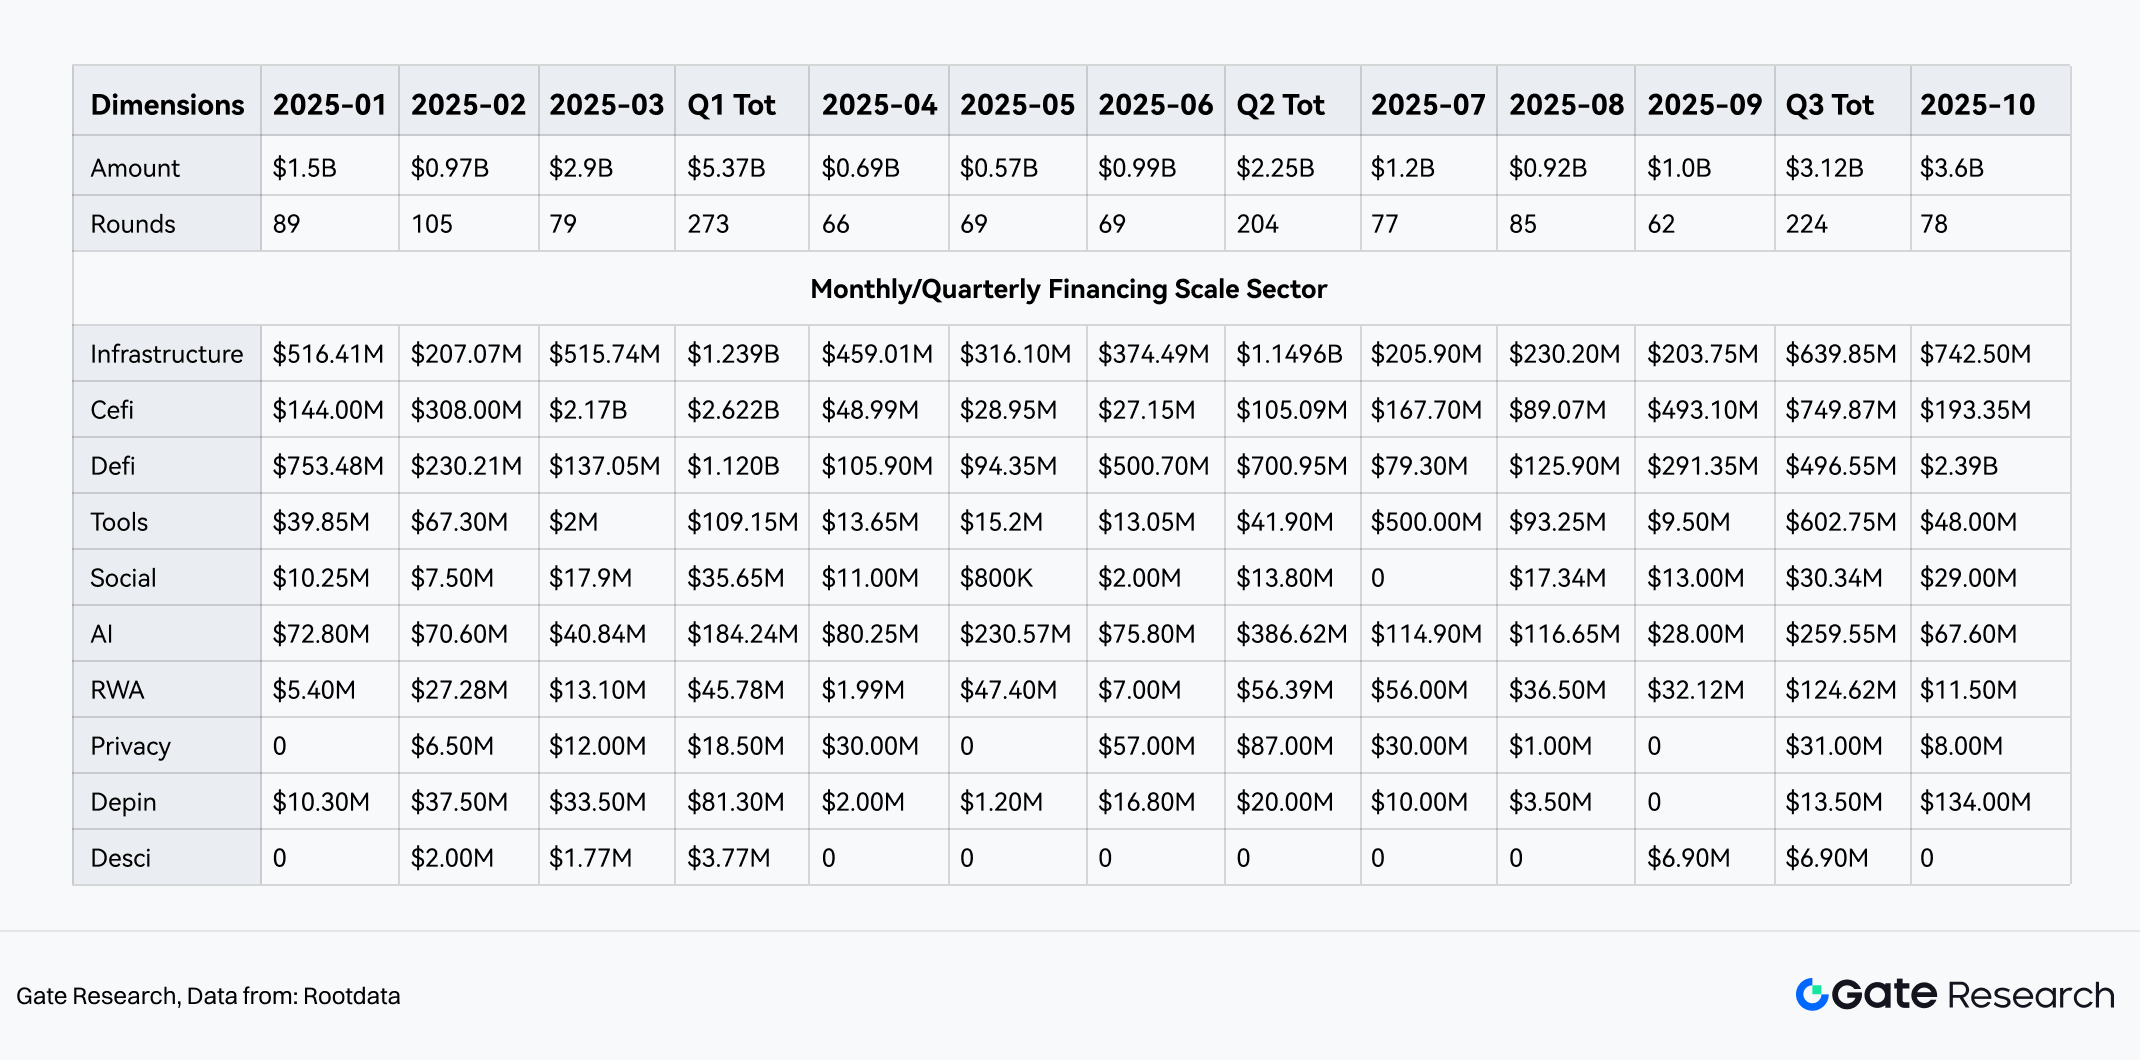
Chart 13: Monthly/Quarterly Funding Size Across Crypto Sectors in 2025
Source From: Rootdata
2. Valuation System Evolution: From “VC Pricing Failure” to “Liquidity-Led Remodeling”
The defining characteristic of the primary market in 2025 was the drastic fluctuation and reconstruction of the valuation system. Data indicates that the primary market experienced a full cycle from “Valuation Inversion (Pricing Failure)” in the first half to “Exchange-Led Repair (Forced Re-anchoring)” in the second half.
2.1 Phenomenon: Structural “Valuation Inversion” and “Bubble Clearing”
Among the 58 TGE projects with complete valuation data statistics, 16 projects (accounting for 27.59%) exhibited the Valuation Inversion phenomenon where “Financing Valuation > Initial FDV.” This means nearly one-third of primary market targets faced “break-even” risks on their first day of listing, indicating a systemic failure in the primary market’s pricing system.
- Hit Zones: The inversion phenomenon was concentrated in Infrastructure (Infra), AI, Public Chain, and DeFi sectors. These projects typically featured “poor financing data performance” and lacked “Top-tier VC endorsement,” leading to rapid value reassessment in a secondary market lacking liquidity support.
- Blocked Exit Paths: Data shows that projects with valuation inversion had an extremely low probability of subsequently listing on the main board of top exchanges, regardless of whether they participated in new token activities (Alpha mechanisms). This suggests that “Valuation Inversion” is often a leading indicator of weak project fundamentals.
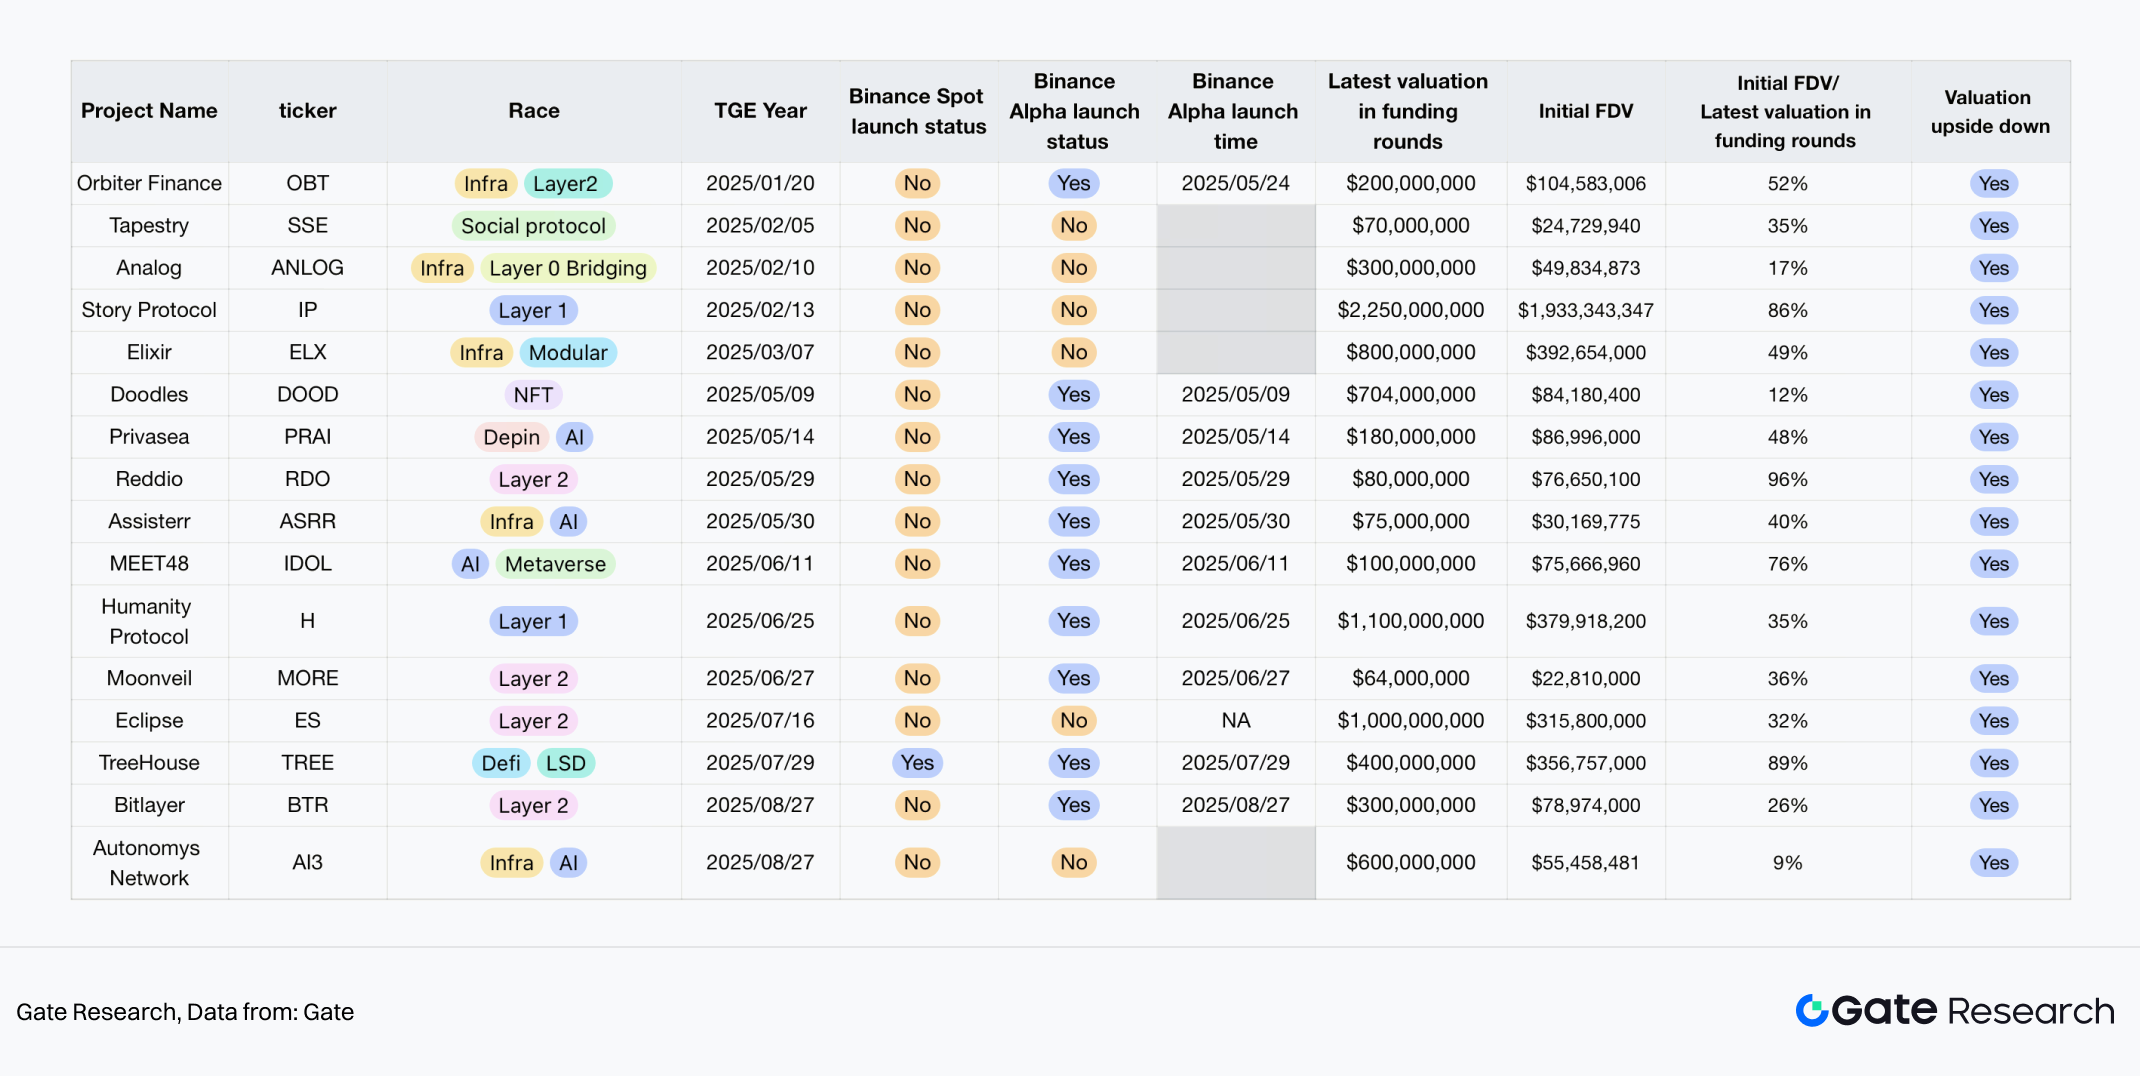
Chart 14: Project samples of the TGE project for the year 2025
Source From: Gate
2.2 Attribution Analysis: Dual Influence of BTC Price and Exchange Mechanisms
The pricing efficiency of the primary market showed significant time-varying correlation with the macro environment (BTC price) and market microstructure (exchange mechanisms).
A. Jan-Apr: Pricing Benchmark Failure (Pre-Intervention Phase) Before the launch of top exchanges’ New Listing Mechanisms, primary market pricing was mainly influenced by Macro Beta.
- February Extreme Market: Except for February, where a general market collapse caused projects to become passively inverted, the inversion situation in Jan-Apr was not significant overall. At this time, the market was in an “unanchored” state, with pricing power held by early VCs and lacking mandatory correction mechanisms.
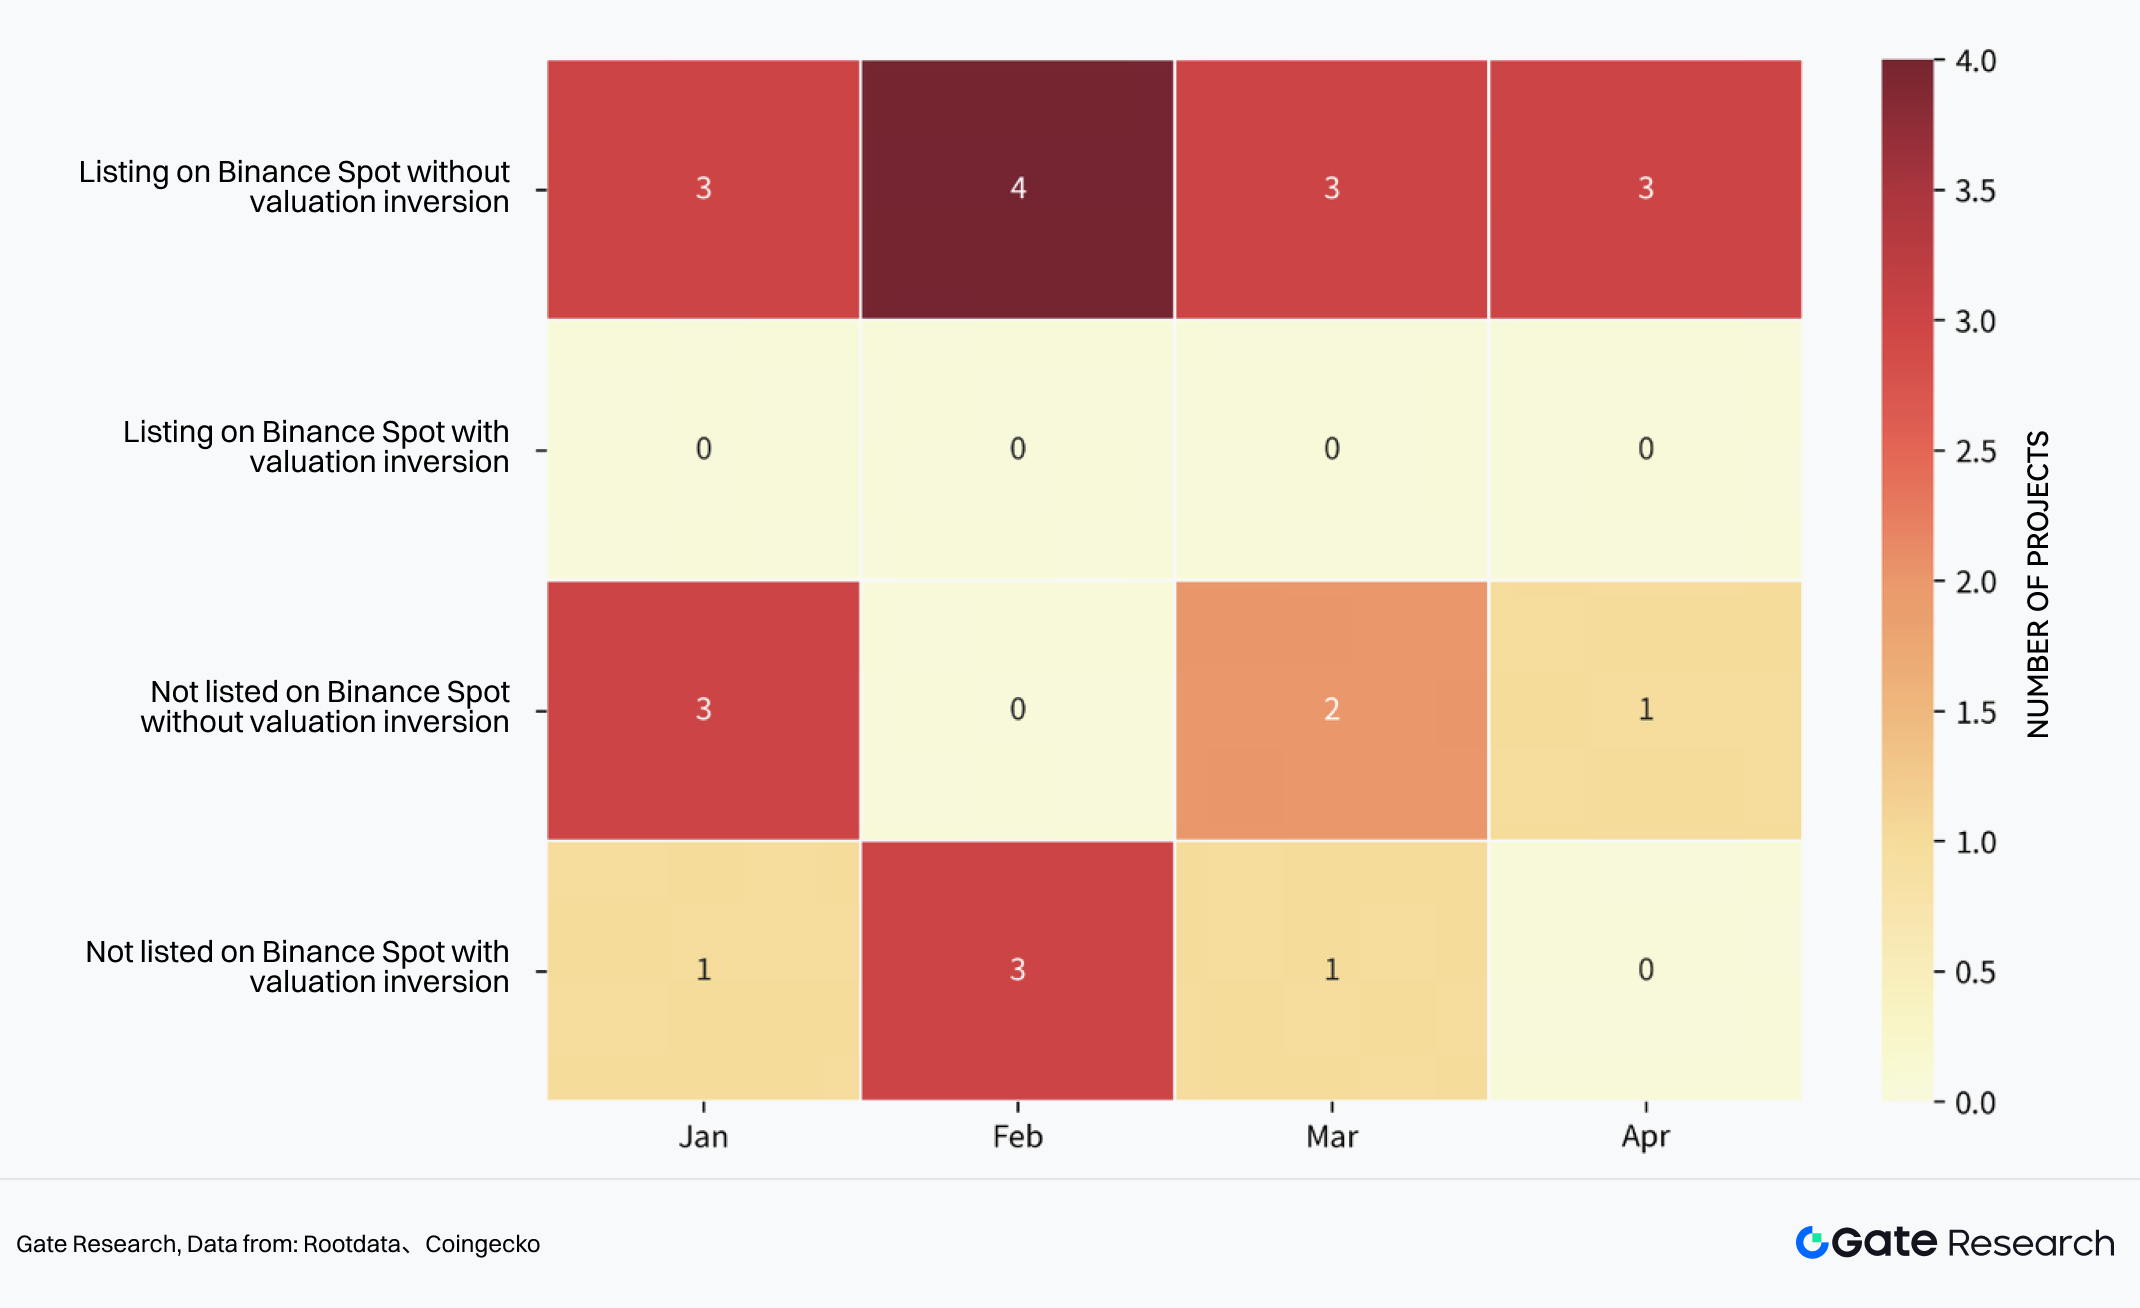
Chart 15: Heat Map of Post-TGE Valuation Inversion Distribution (January-April 2025)
Source From:Rootdata, Coingecko
B. May-Nov: “Forced Re-anchoring” Under Exchange Mechanisms (Post-Intervention Phase) May was a key watershed moment. With top exchanges launching New Listing Mechanisms (Alpha Mechanism), market pricing logic was forcefully reshaped, presenting two distinct stages:
Stage 1: Artificially Created “Value Depression” (May-June)To activate liquidity, platforms adopted aggressive “FDV Suppression” strategies in the early stages of mechanism implementation.
- Data Verification: For projects listed under this mechanism in May-June, the average ratio of Initial FDV / Financing Round Valuation was compressed to 95%, causing the valuation inversion rate during this period to spike to over 50%.
Conclusion:** This was a “shock therapy” to rebuild secondary market trust. Although it sacrificed short-term book returns for primary investors, it successfully squeezed out bubbles.
- Data Verification: For projects listed under this mechanism in May-June, the average ratio of Initial FDV / Financing Round Valuation was compressed to 95%, causing the valuation inversion rate during this period to spike to over 50%.
Stage 2: Re-inflation of Valuation Bubbles (July-Nov) With the recovery of BTC prices in August and market adaptation to the new mechanism, policy restrictions began to relax, and valuations rebounded rapidly.
Data Verification: After July, the valuation inversion phenomenon basically disappeared. After BTC prices rose in September, projects with an Initial FDV / Financing Valuation ratio in the 200%-1000% range regained dominance (accounting for 70%+). Crazy Multiples: In July-Nov, the average value of this ratio rebounded amazingly to 857%. Some hot projects (e.g., $2Z, $MMT) saw their Initial FDV rise more than 15 times compared to their last financing valuation. This marks that against the backdrop of dried-up primary financing, capital frantically chased a few determined top TGE targets, forming new local bubbles.
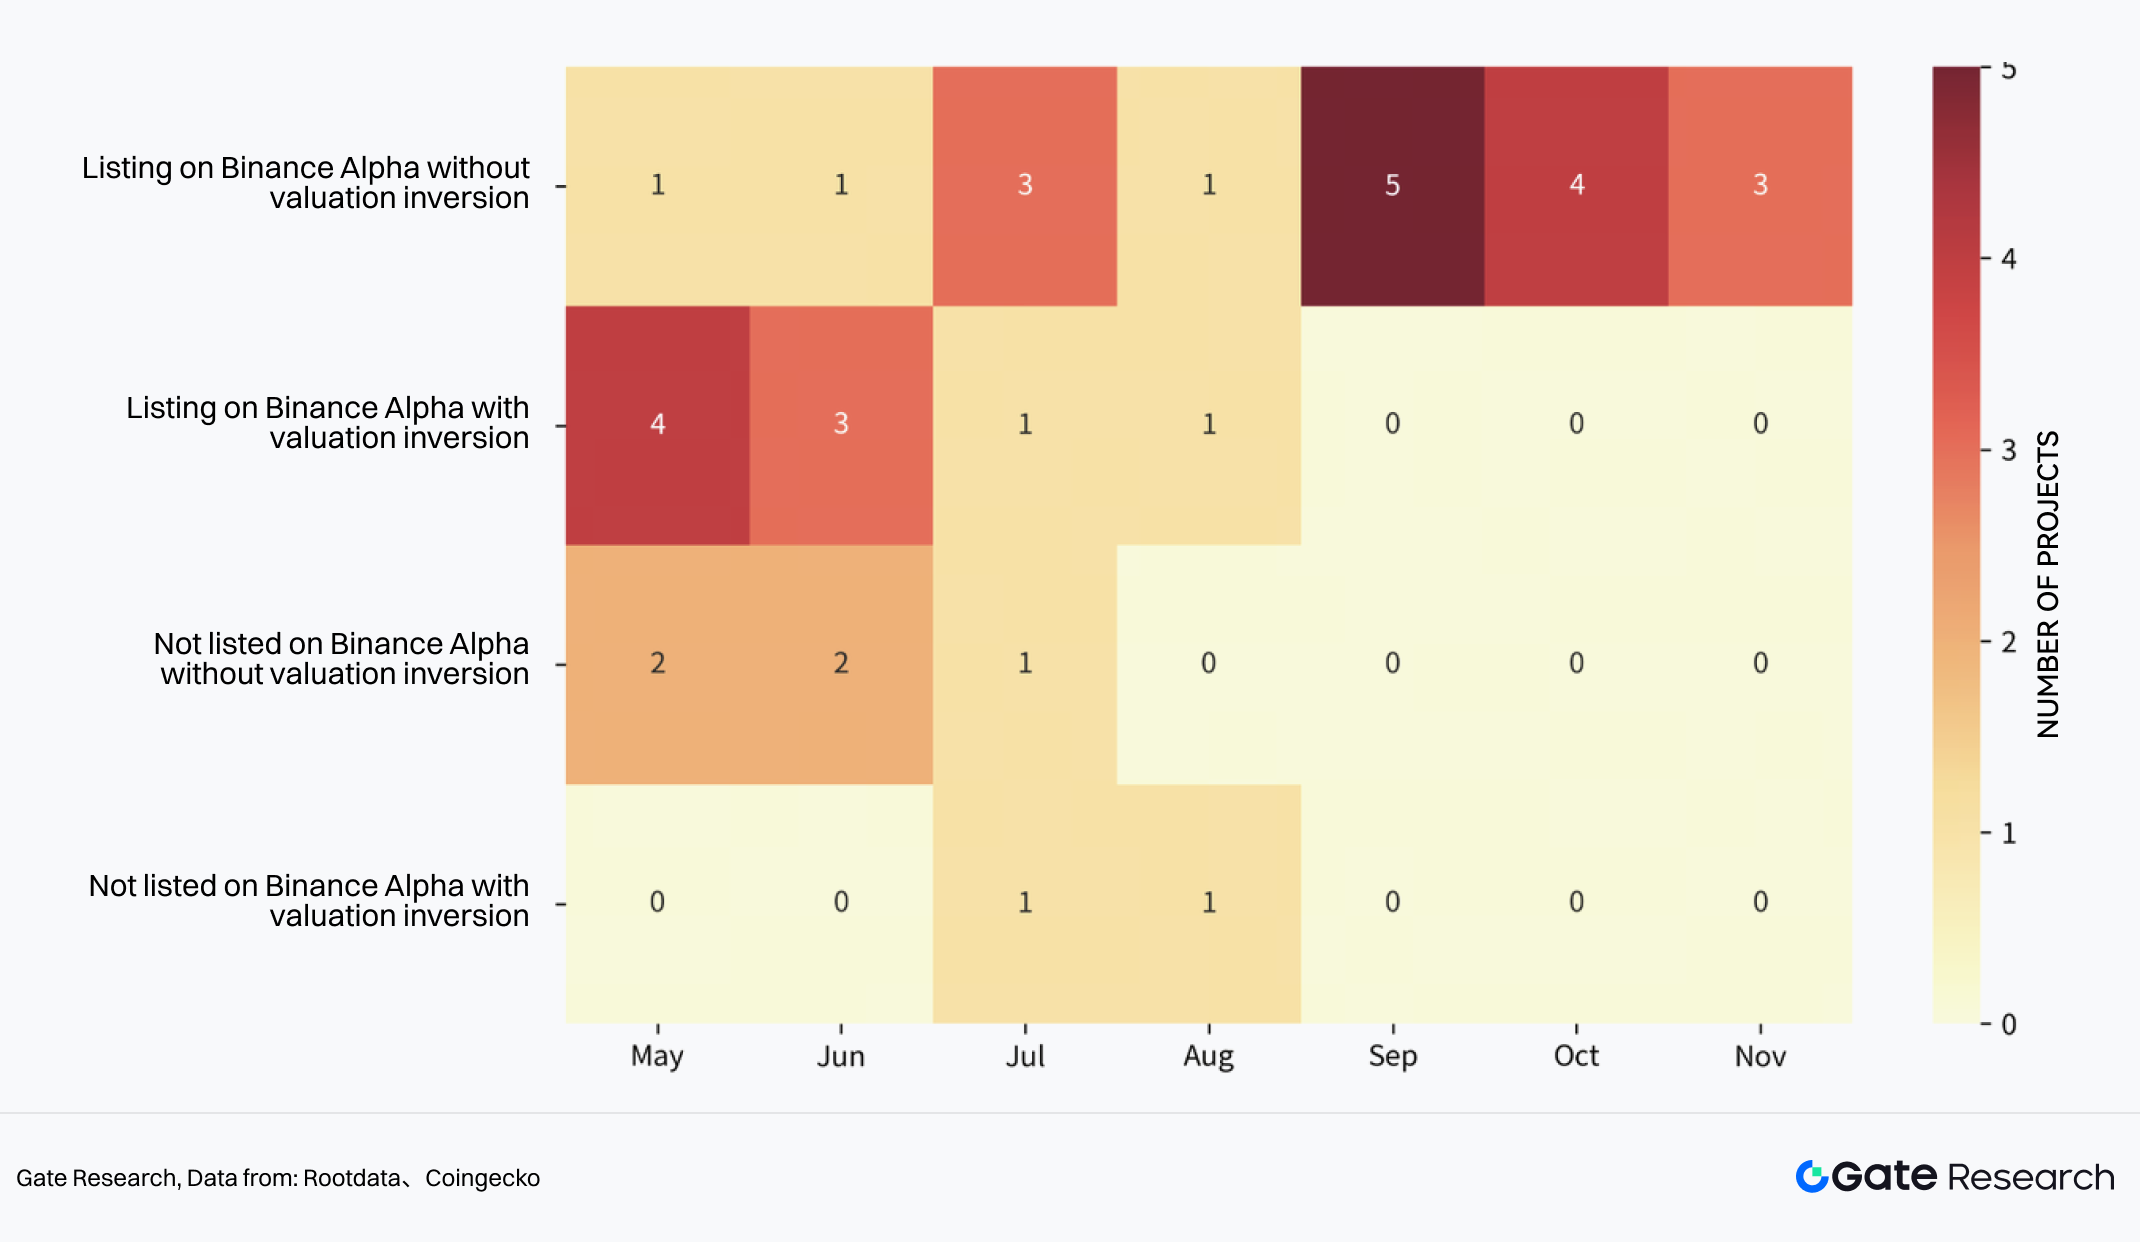
Chart 16: Heat Map of Post-TGE Valuation Inversion Distribution (May-November 2025)
Source From:Rootdata, Coingecko
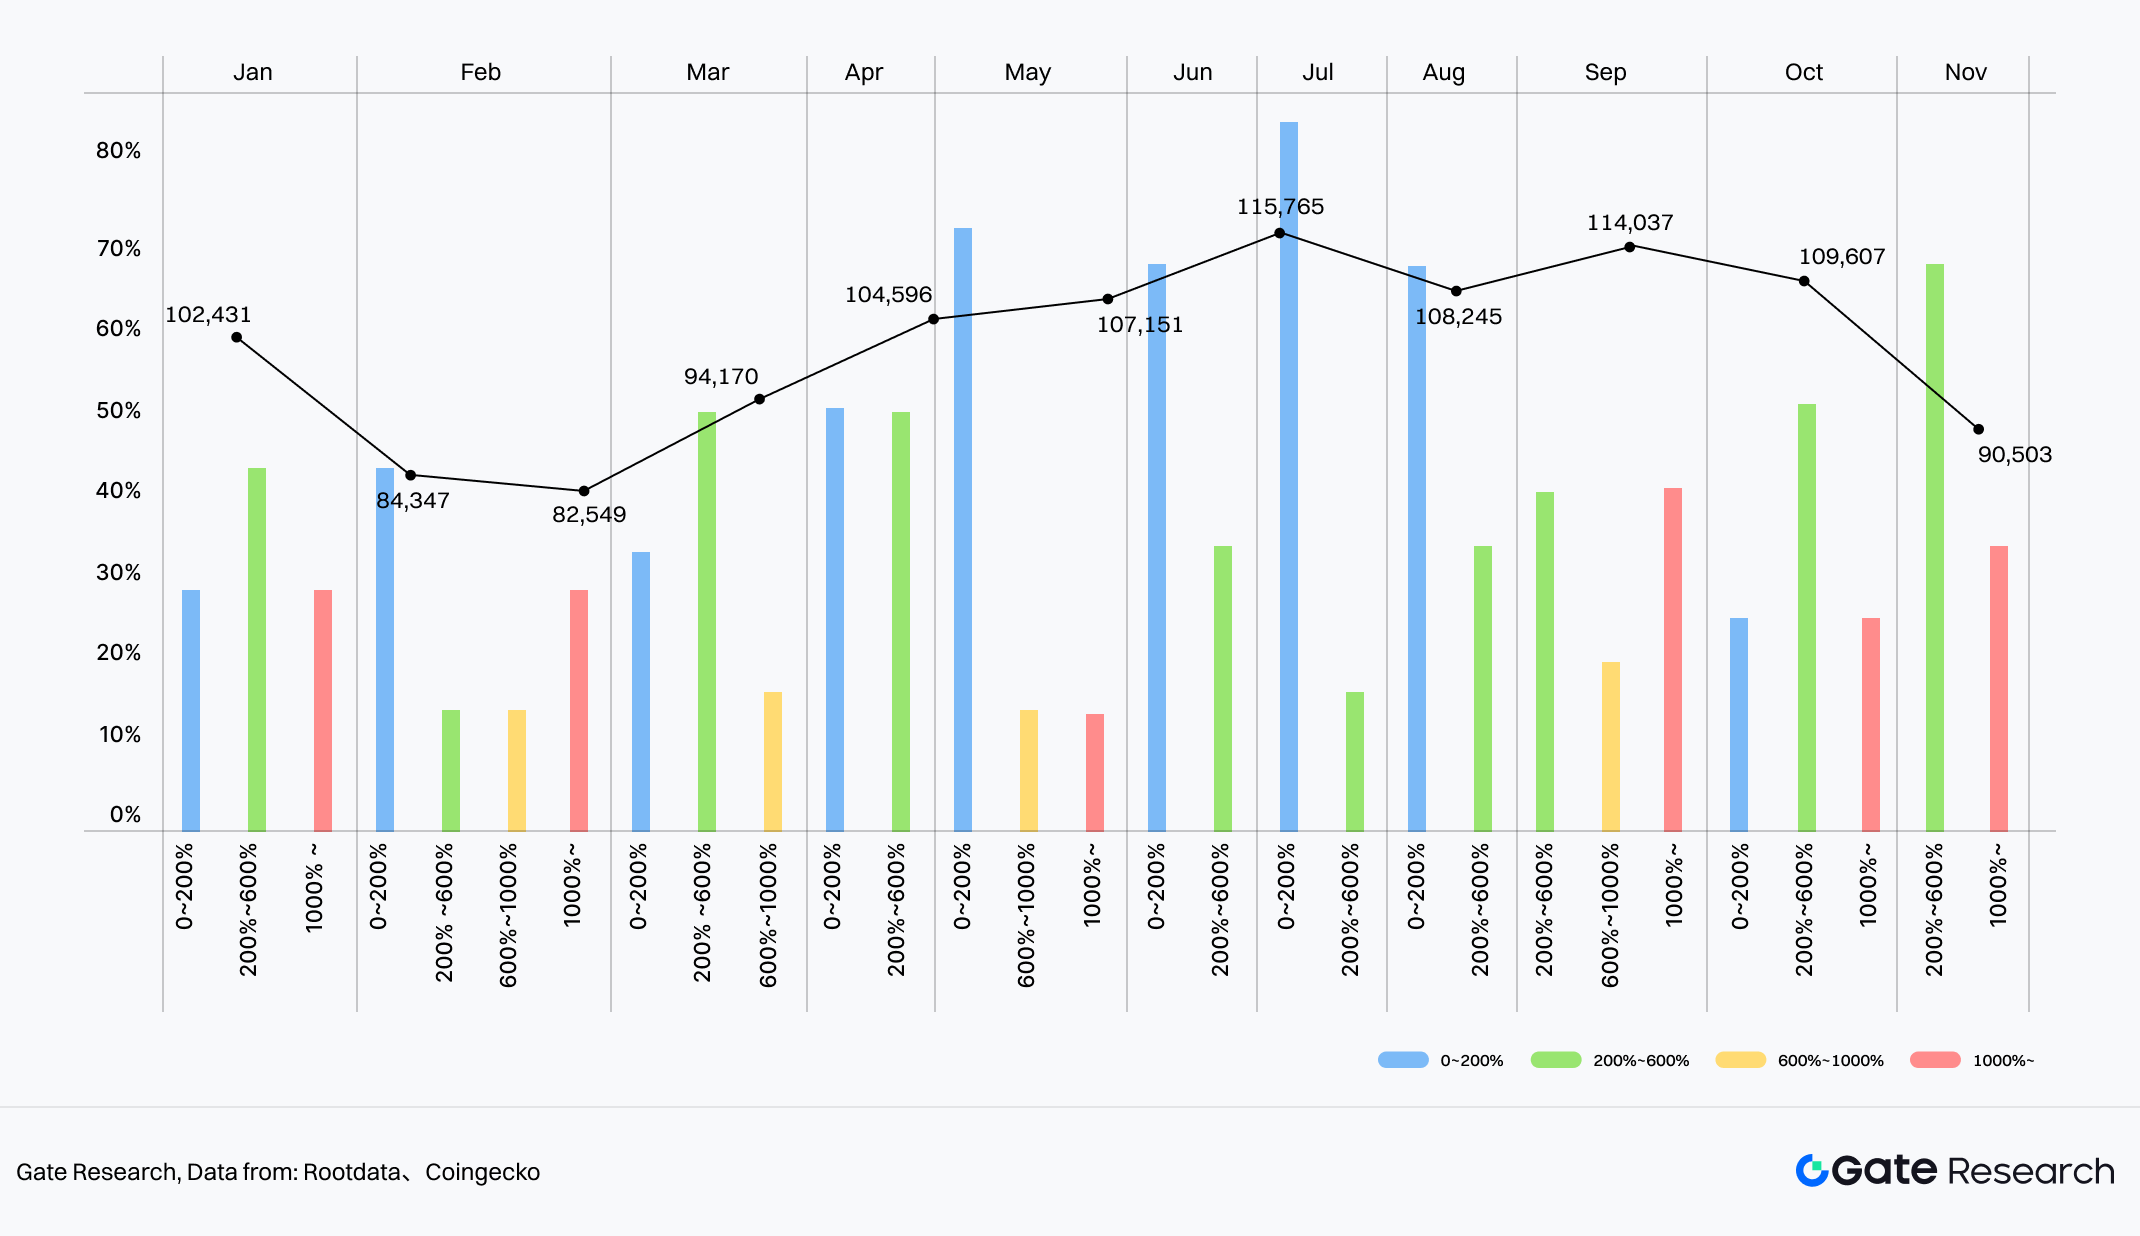
Chart 17: Monthly Change in Initial FDV / Last-Round Valuation vs. BTC Price
Source From:Rootdata, Coingecko)
Data Insight: The inversion in the first half was mainly triggered by the extreme market in February, when the market had not yet established effective pricing correction mechanisms.
2.3 Conclusion: The transfer of pricing power
The valuation data of 2025 reveals a brutal reality: The pricing power of the primary market has been deeply ceded to secondary liquidity channels.
- When exchanges needed to create a wealth effect (May-June), primary valuations were compressed by the market into inversion;
- When macro sentiment warmed and compliance channels opened (after August), the premium capability of the secondary market (857%) far exceeded VC imagination. For future investors, judging whether a project’s valuation is reasonable is no longer about “how much money was raised,” but whether it fits the cyclical pricing window of the “Exchange New Token Mechanism.”
The data for this chapter is up to: The financing and valuation sample is up to November 11, 2025; the screening date for the token economics sample is December 4, 2025.
3 Tokenomics Evolution: Structural Differentiation on the Supply Side
3.1 Macro Characteristics: Rigid Unlocking Models vs. Mutant Distribution Structures
Based on statistics from 50+ hot new TGE projects in 2024-2025 (Current FDV > $10M), we found:
- Unlock Model Inertia: The market is still dominated by the “Cliff + Linear” model. The average unlocking period for investors and teams remains over 3 years, and in 57% of projects, the unlocking terms for both are exactly the same (deeply bound). This means supply-side pressure from early stages has not been alleviated through mechanism innovation.
- Structural Mutation: The real game takes place in “Initial Circulation Ratio” and “Benefit Distribution Structure.” Different sectors have taken completely different distribution paths based on their own survival logic.
3.2 Sector Differentiation: Micro-Games in Seven Major Sectors
Token allocation is no longer just a numbers game, but a reflection of the different trade-offs between “Capital Dependency” and “Community Consensus” in each sector.
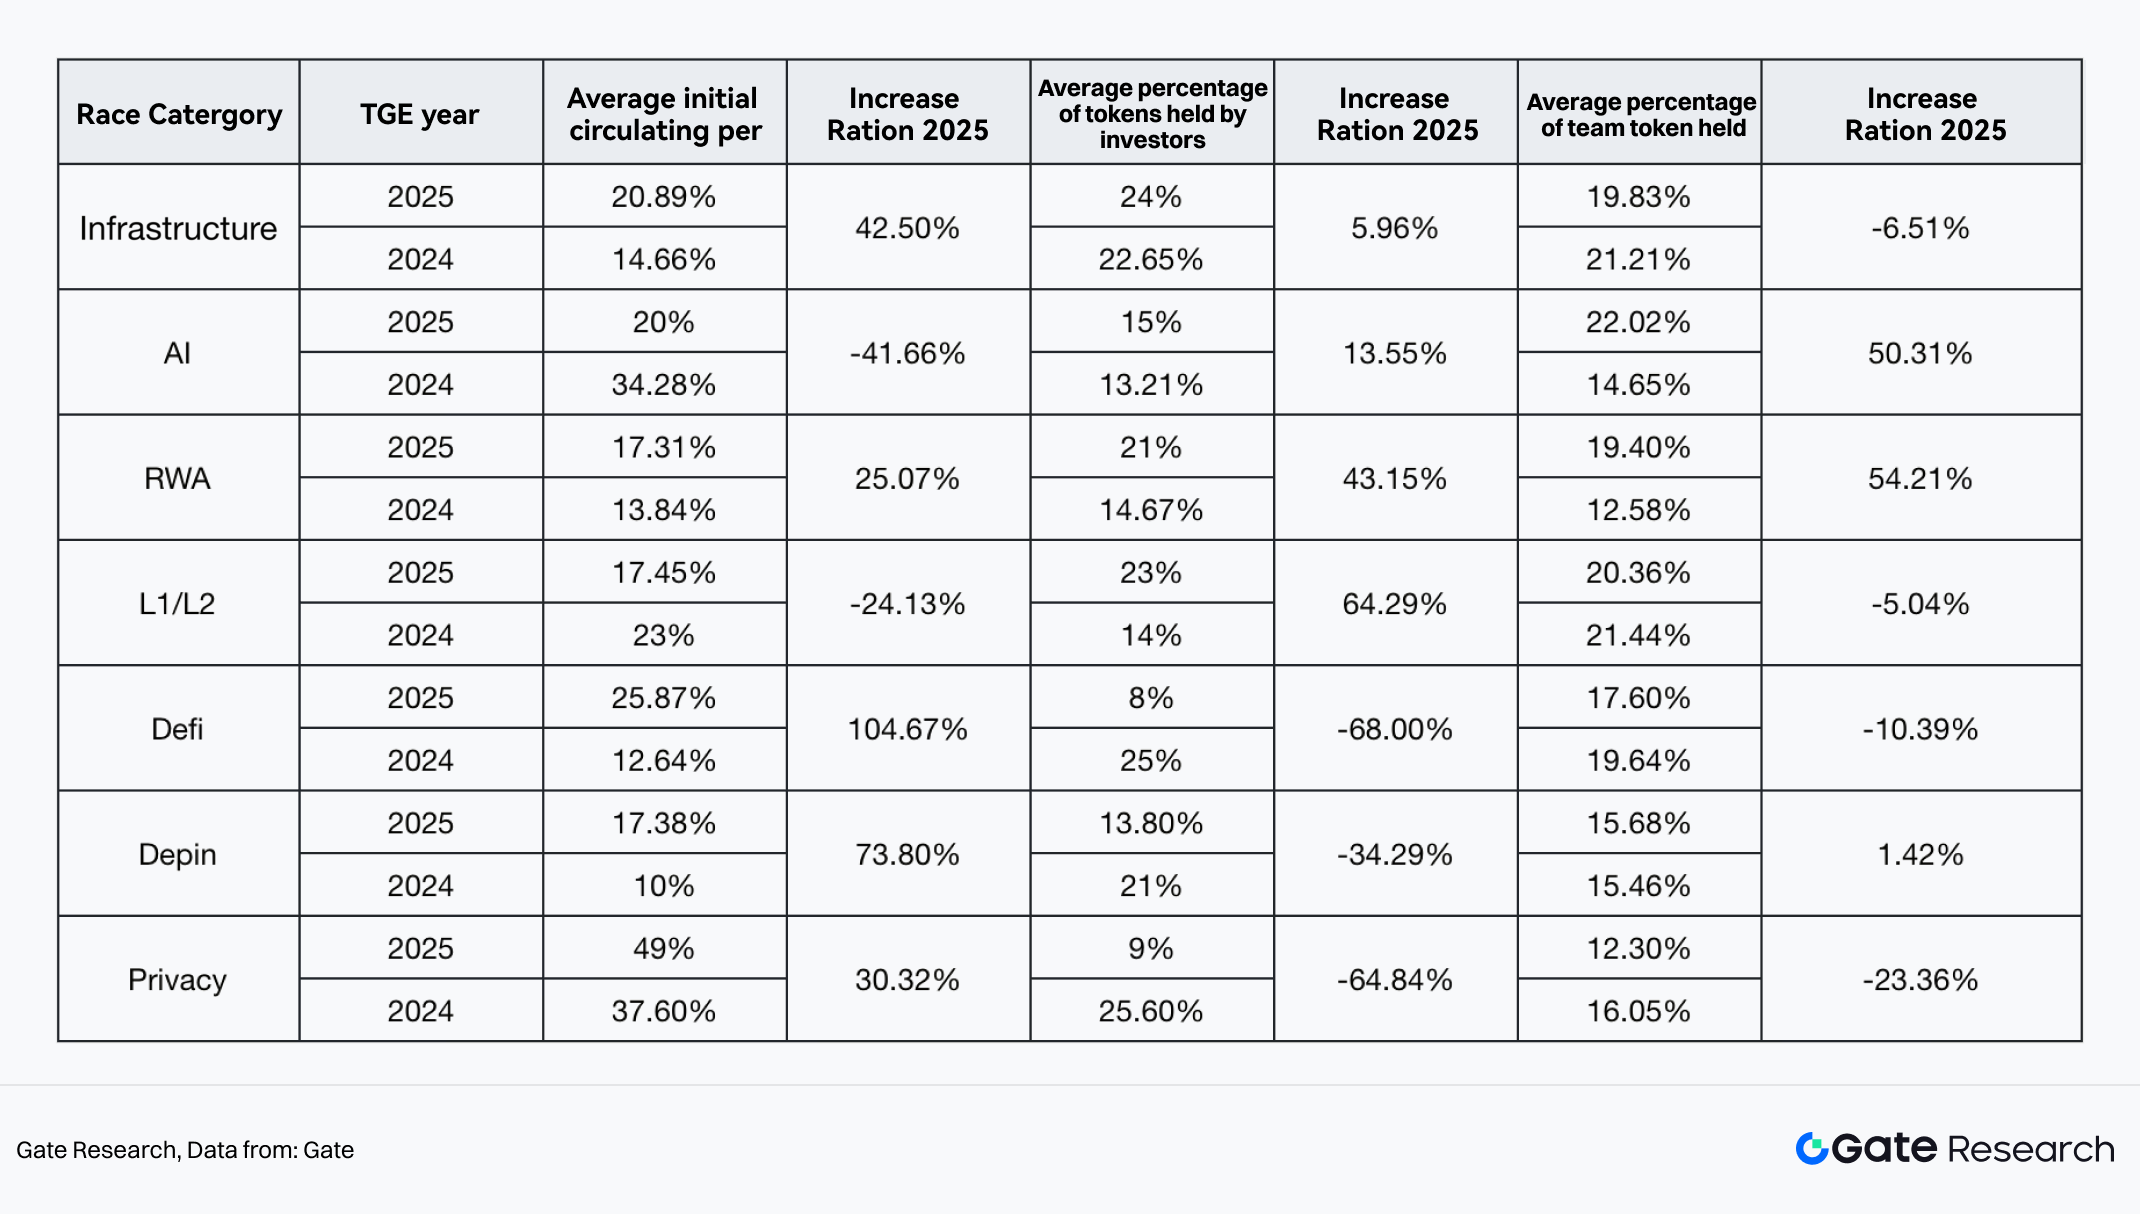
Chart 18: Changes in TGE Token Distribution for 7 Major Segments in 2025
Source From:Gate
Analysis of over 50 hot new TGE projects from 24-25 across seven core sectors (Infrastructure, AI, RWA, L1/L2, DeFi, DePIN, Privacy) follows:
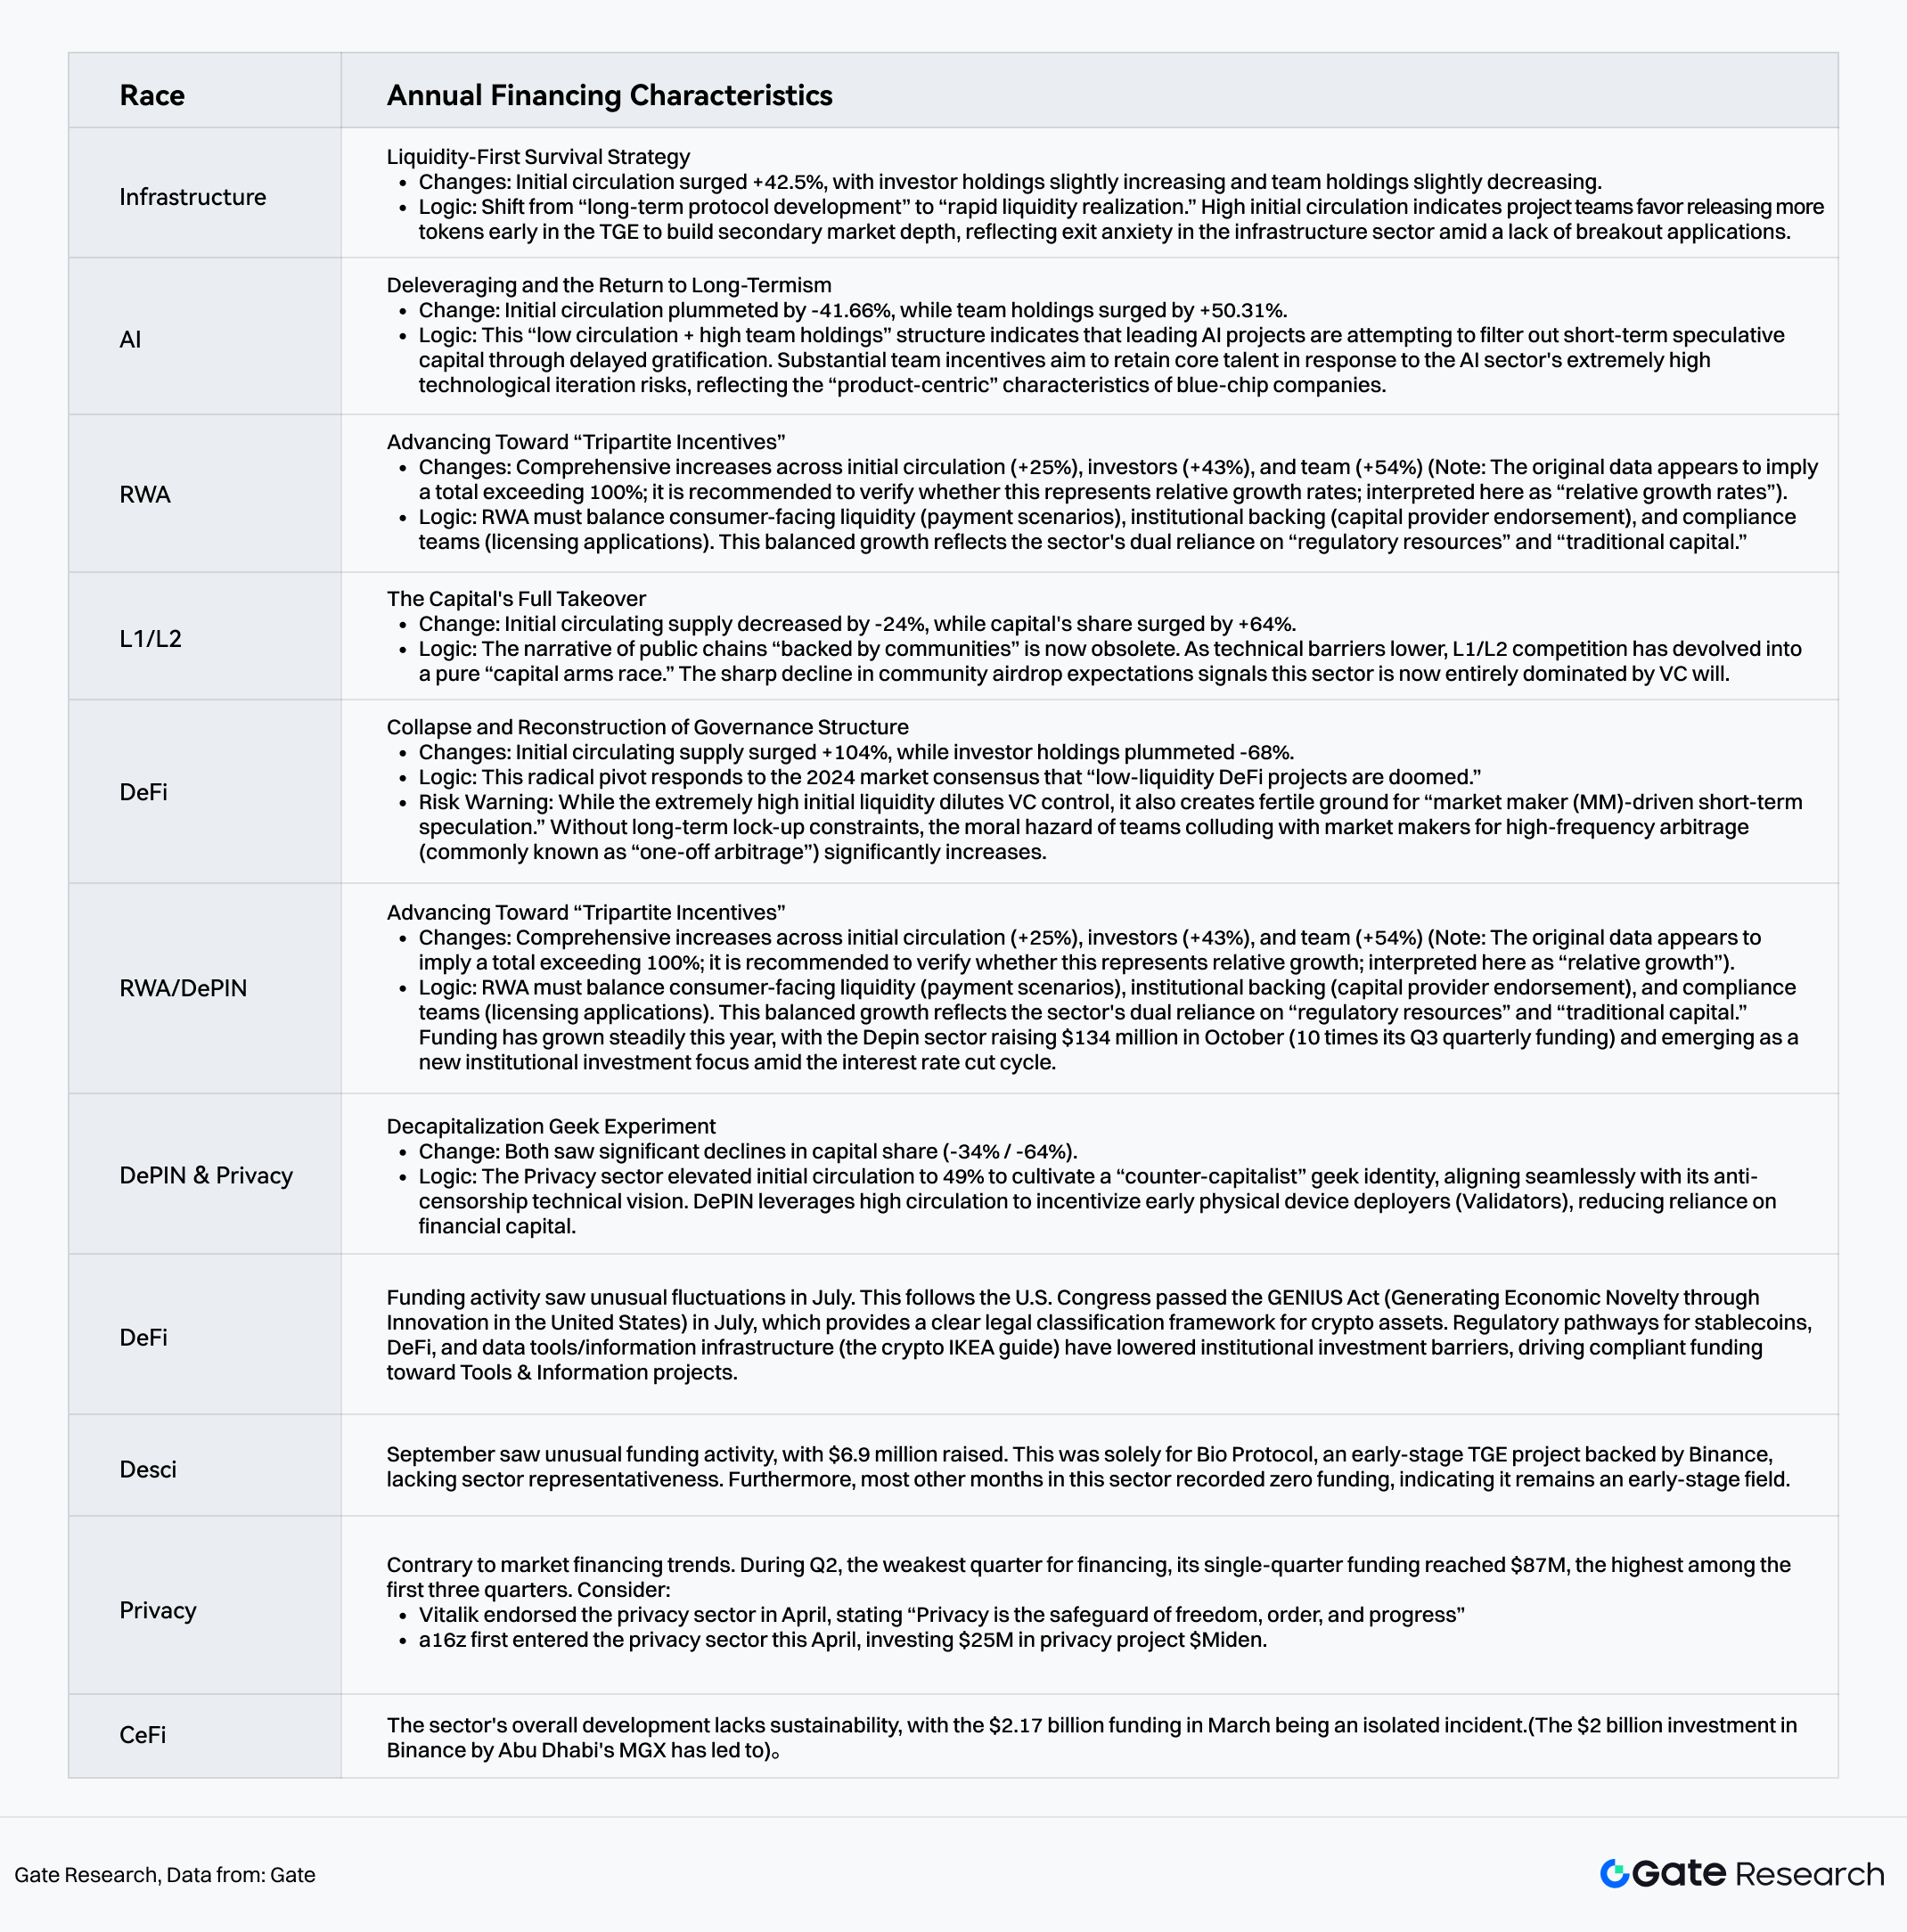
Chart 19: Analysis of the Current Status of the Major Industry Segments in 2025
Source From:Gate
3.3 Chapter Summary
Looking at all sectors, the evolution of tokenomics is essentially “Redistribution Rebalancing under a Zero-Sum Game.” Regrettably, we have not seen mechanism innovations similar to the DeFi Summer era (like VeModel). Current adjustments are more of a zero-sum game between projects “appeasing the community” and “satisfying investors.”
4. Annual Narrative Evolution: The Profit-Seeking Map of Capital Flows
The market narrative in 2025 showed clear quarterly rotation characteristics. Capital no longer blindly flooded all sectors but switched rapidly between different sectors based on “ROI” and “Mindshare.”
ROI: Benchmarked against the market capitalization at the beginning of the year, this calculates the relative growth of a specific sector at the current time to reflect its investment return efficiency. Formula: (Current Market Cap - Market Cap at Start of Year) / Market Cap at Start of Year × 100%.
Mindshare: Characterized by the share of total discussion volume related to a specific narrative on platform X within a specific timeframe, reflecting the market attention and influence of that narrative. Calculated using the Dexu platform’s proprietary methodology and data.
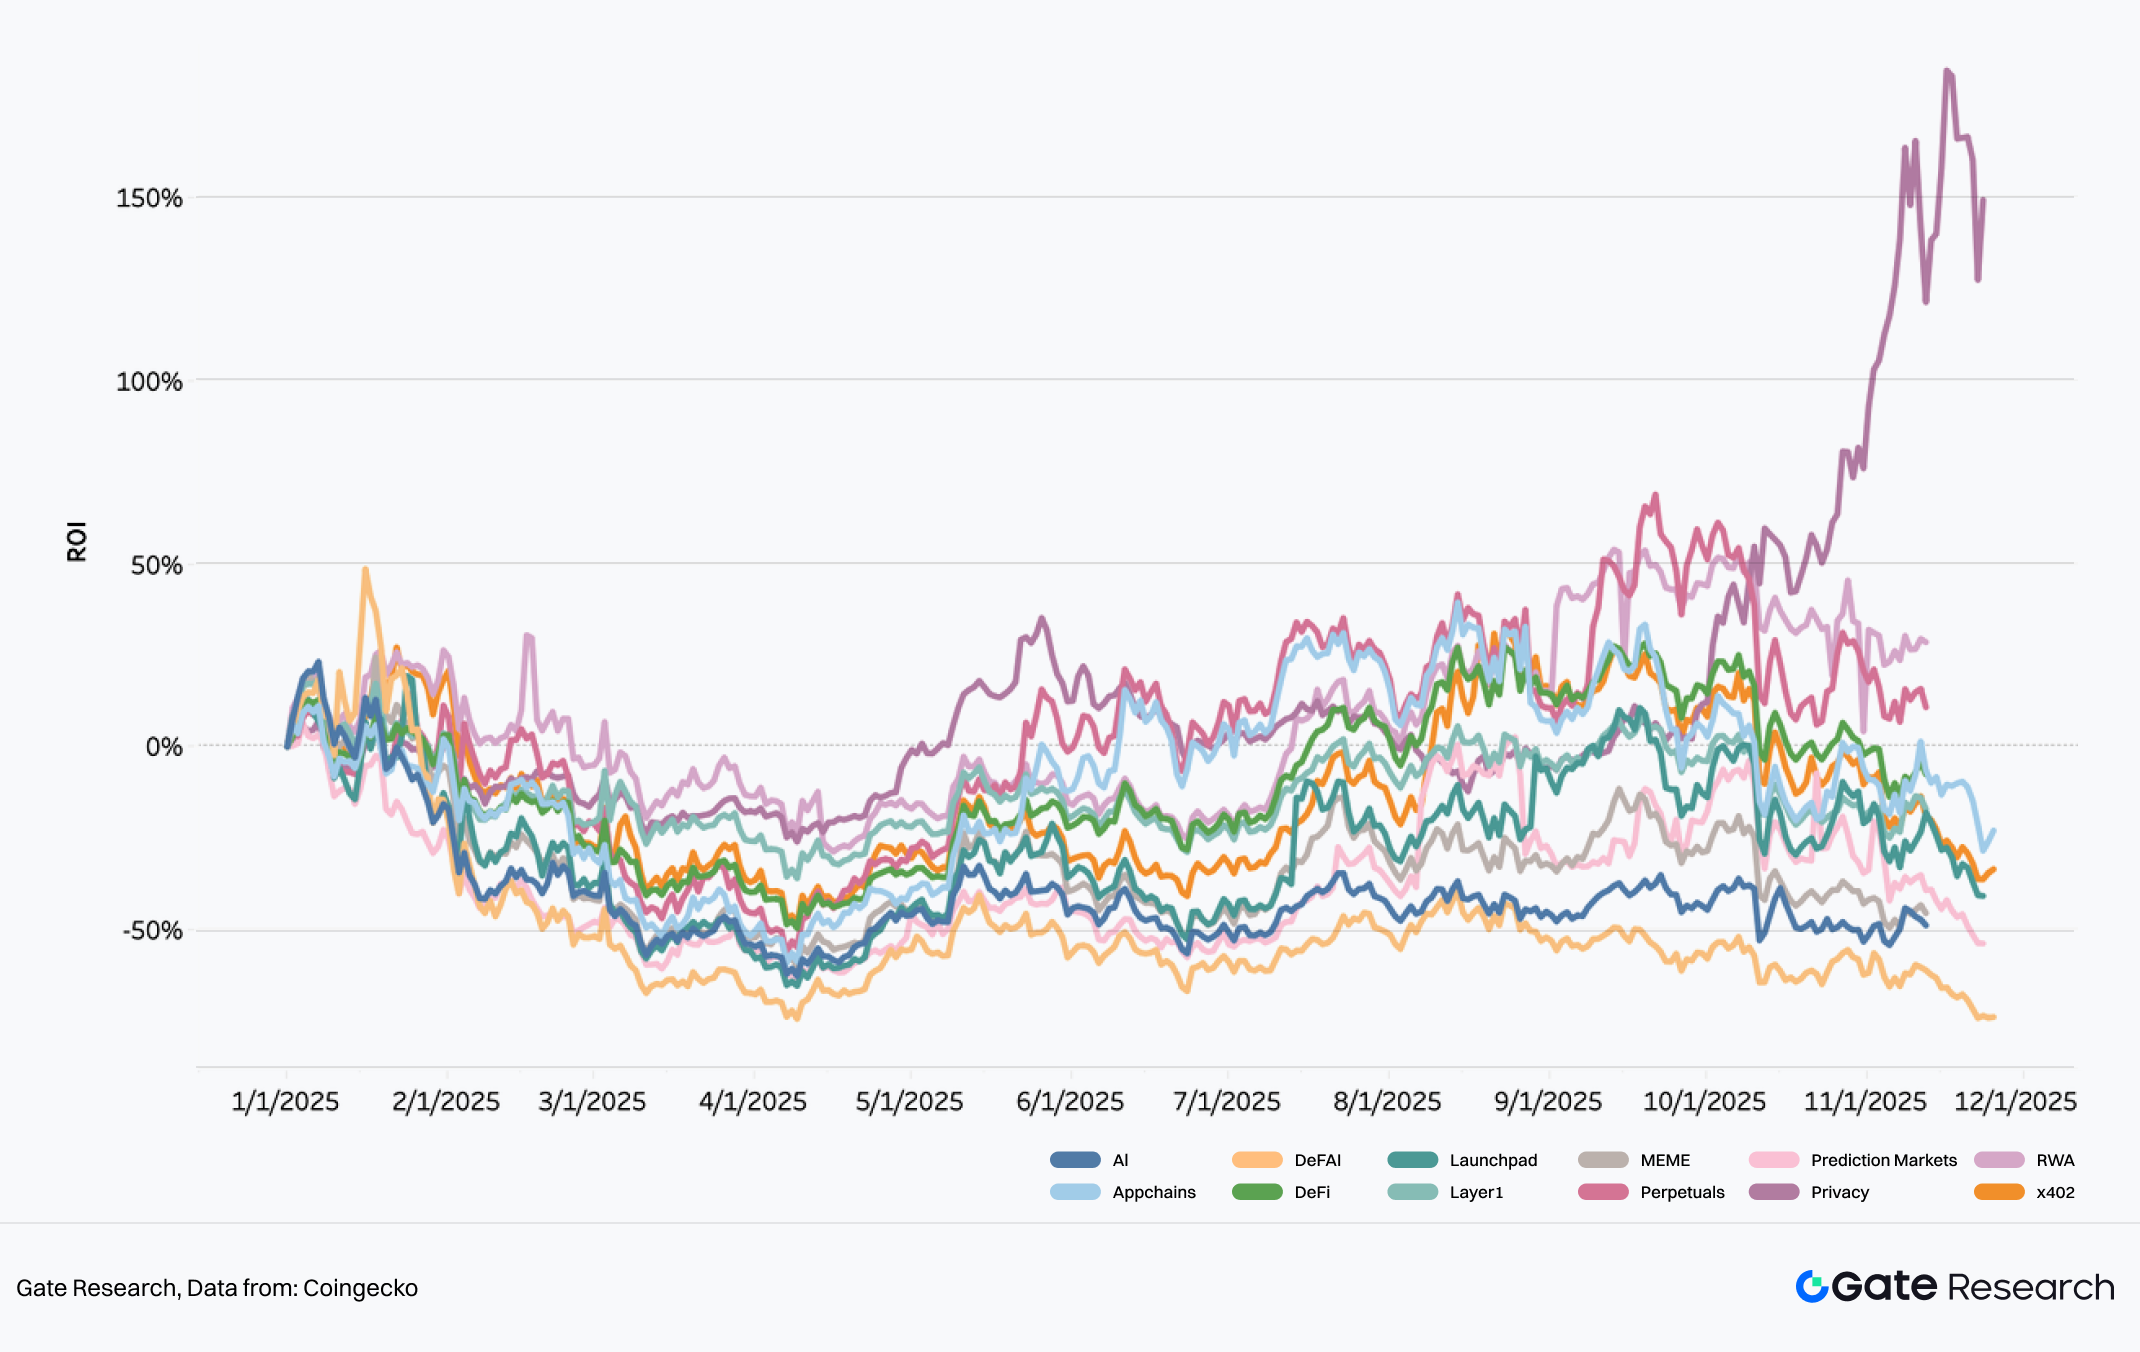
Chart 20: ROI Trends of Hot Sectors in 2025
Data Source:Coingecko
Insight: The window period for excess returns in sectors is shortening, and the speed of capital migration from one hotspot to the next has significantly accelerated.
4.1 Q1: Independent Rally of AI Financialization (DeFAI)
- Keywords: Strong Financial Attributes, AI Meme Continuation
- Performance: Carrying over the heat from late 2024, DeFAI led Q1 with 8.02% Mindshare.
- Logic: DeFAI successfully translated the technical narrative of AI into tradable financial assets, fitting the crypto capital preference for high volatility and high concepts. The sector’s high point ROI touched 48.56%, significantly outperforming the broader market
Market sentiment in the AI sector continued the AI Meme frenzy from late 2024, reaching a Mindshare of 8.02%. DeFAI became the focal point of the quarter and led the rally due to its strong financial attributes that highly align with the crypto space, touching a peak ROI of 48.56% and significantly outperforming other sectors.
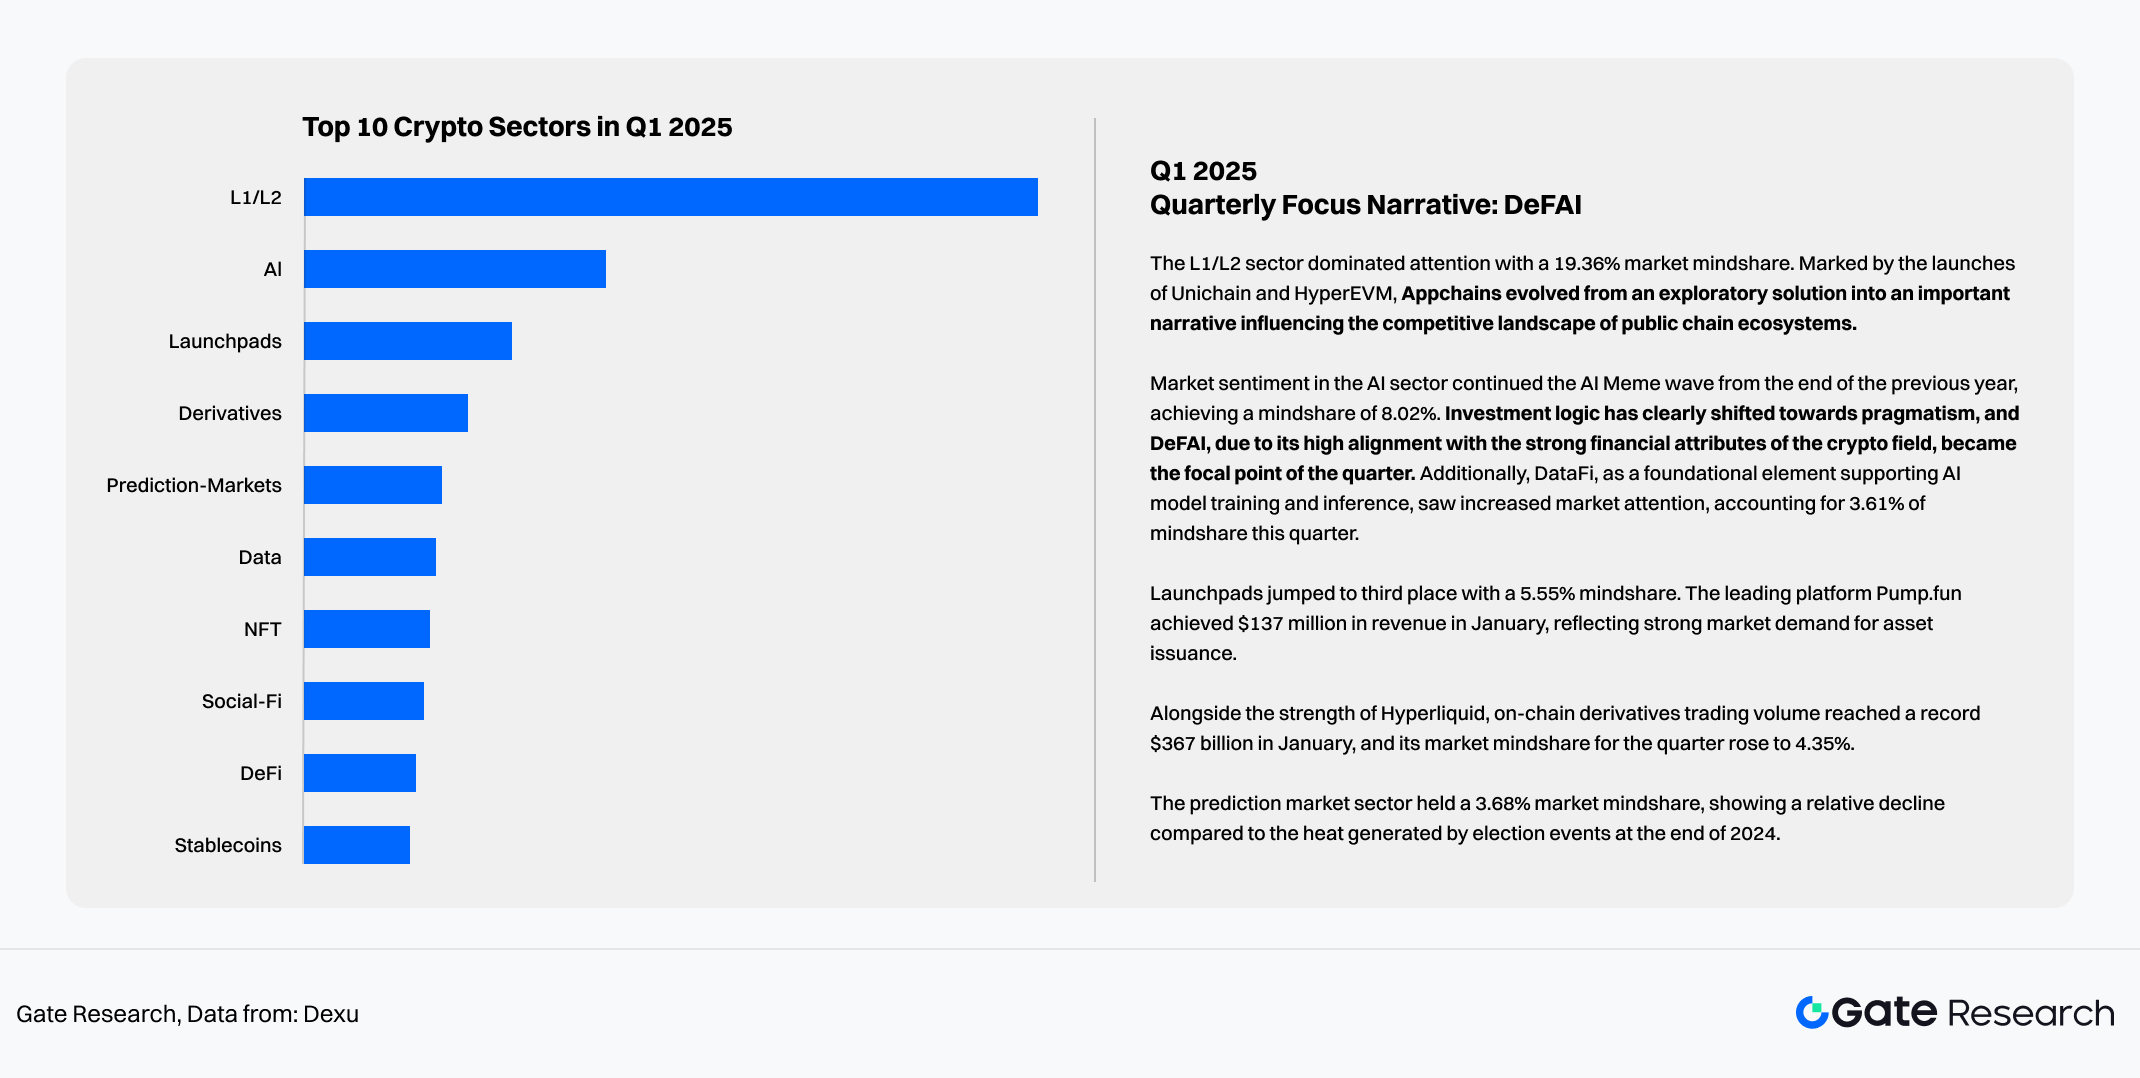
Chart 21: Top 10 Crypto Sectors in Q1 2025
Data Source:Dexu
4.2 Q2: Renaissance of Launchpads (Meme Launchpads)
- Keywords: Traffic Monetization, Pump.fun Effect
- Performance: Sector ROI rose against the trend by 38.75%.
- Logic: Under the demonstration effect of Pump.fun’s strong cash flow, Launchpads evolved from simple tool platforms to “Ecosystem Liquidity Engines.” Competitors like Believe and Letsbonk emerged, competing for long-tail traffic by optimizing creator incentives, driving the prosperity of surrounding ecosystems like DEXs and aggregators.
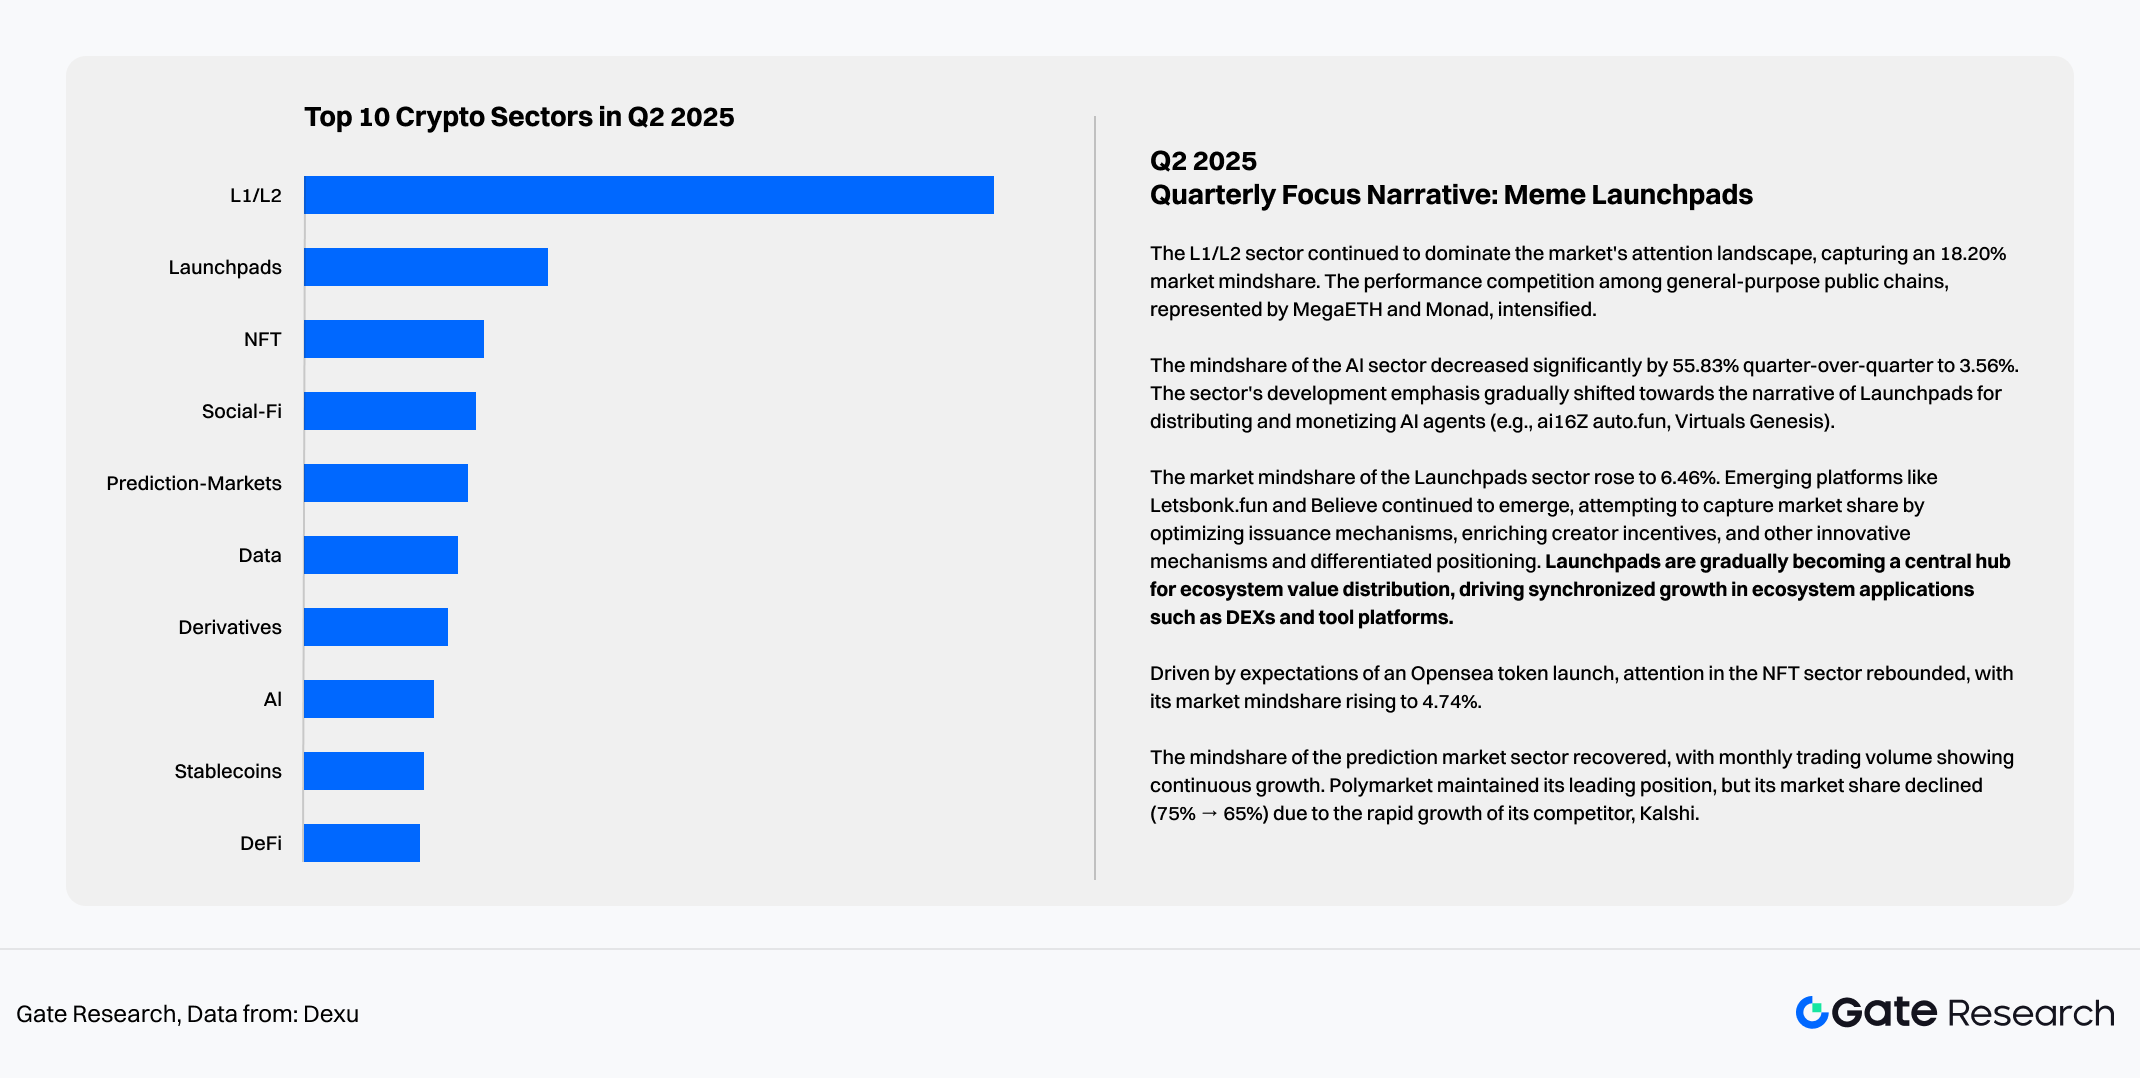
Chart 22: Top 10 Crypto Sectors in Q2 2025
Data Source:Dexu
4.3 Q3: Micro-Recovery of Stablecoin Chains and IDOs
- Keywords: Value Distribution Reconstruction, IDO Launchpads
- Logic Shift: The market began to reflect on the imbalance of benefit distribution between stablecoin issuers and underlying public chains. Trends of giants like Circle and Tether building their own chains drove the explosion of the “Stablecoin Chain” narrative (e.g., Plasma public sale selling out instantly).
- IDO Warm-up: Platforms like Buildpad, through compliant transformation, took over the capital vacuum after the Meme recession. The Launchpads sector showed a Divergent Trend from the Meme sector for the first time (i.e., Meme down, Launchpads up), indicating rigid market demand for “Primary Issuance of Quality Assets.”
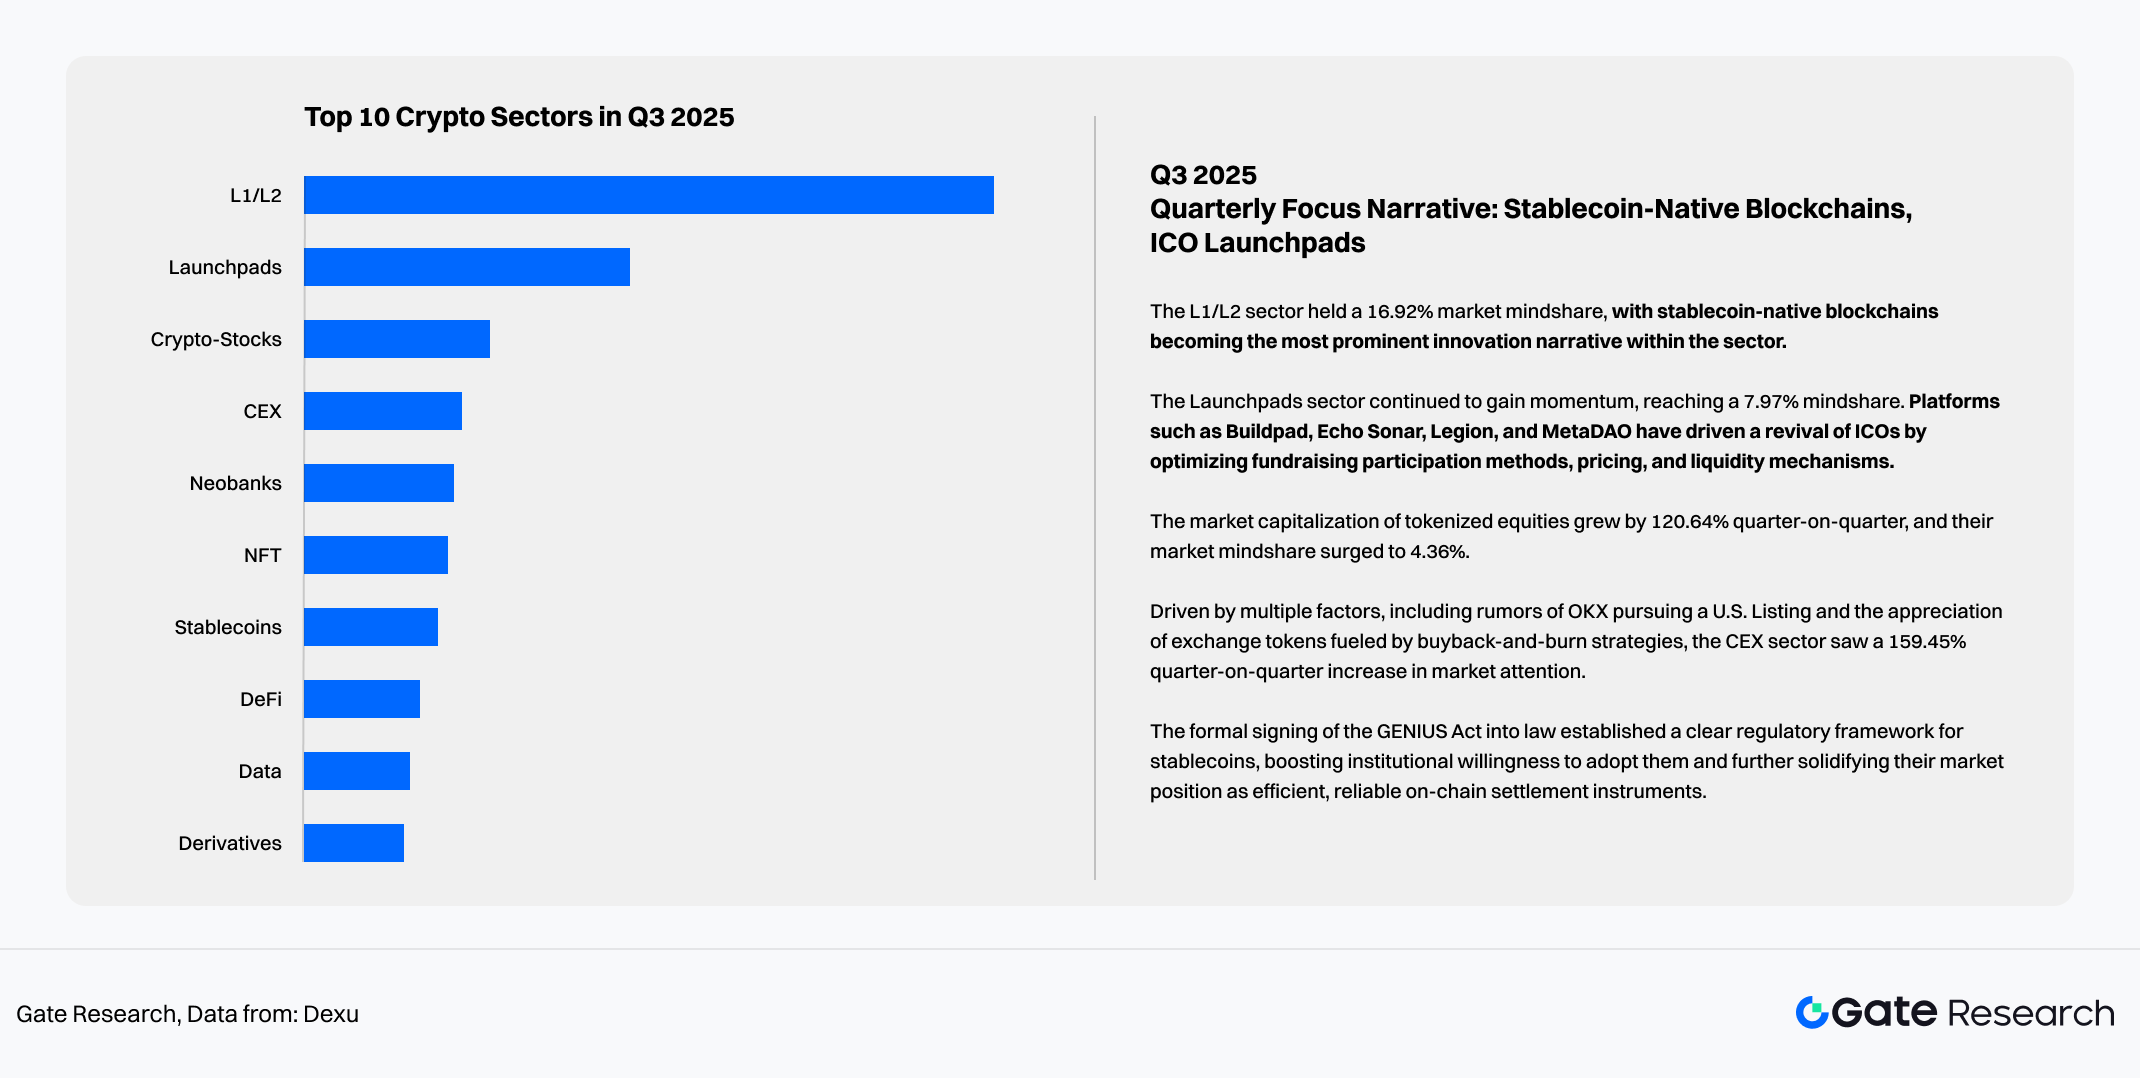
Chart 23: Top 10 Crypto Sectors in Q3 2025
Data Source:Dexu
4.4 Q4 (Oct-Nov): Trading and Privacy Game Under High Volatility
- Keywords: On-chain Derivatives, Prediction Markets, Privacy Return
- Performance: Derivatives sector ROI surged to 61.25% in October, with monthly on-chain volume hitting a historic peak of $1.37T.
Logic:
Perp Dex: The rise of projects like Aster validated the feasibility of high-performance on-chain matching, absorbing trading demand spilling over from CEXs.
- Prediction Markets: Polymarket and Kalshi formed a duopoly backed by Wall Street capital (like ICE), with monthly volume breaking ten billion, becoming a killer app for Web3 mainstream adoption.
- Privacy: Privacy-related sectors recorded significant excess returns (236.71% increase) during the sample period, reflecting that under the trend of regulatory transparency, some capital began increasing allocation to privacy-attributed assets.
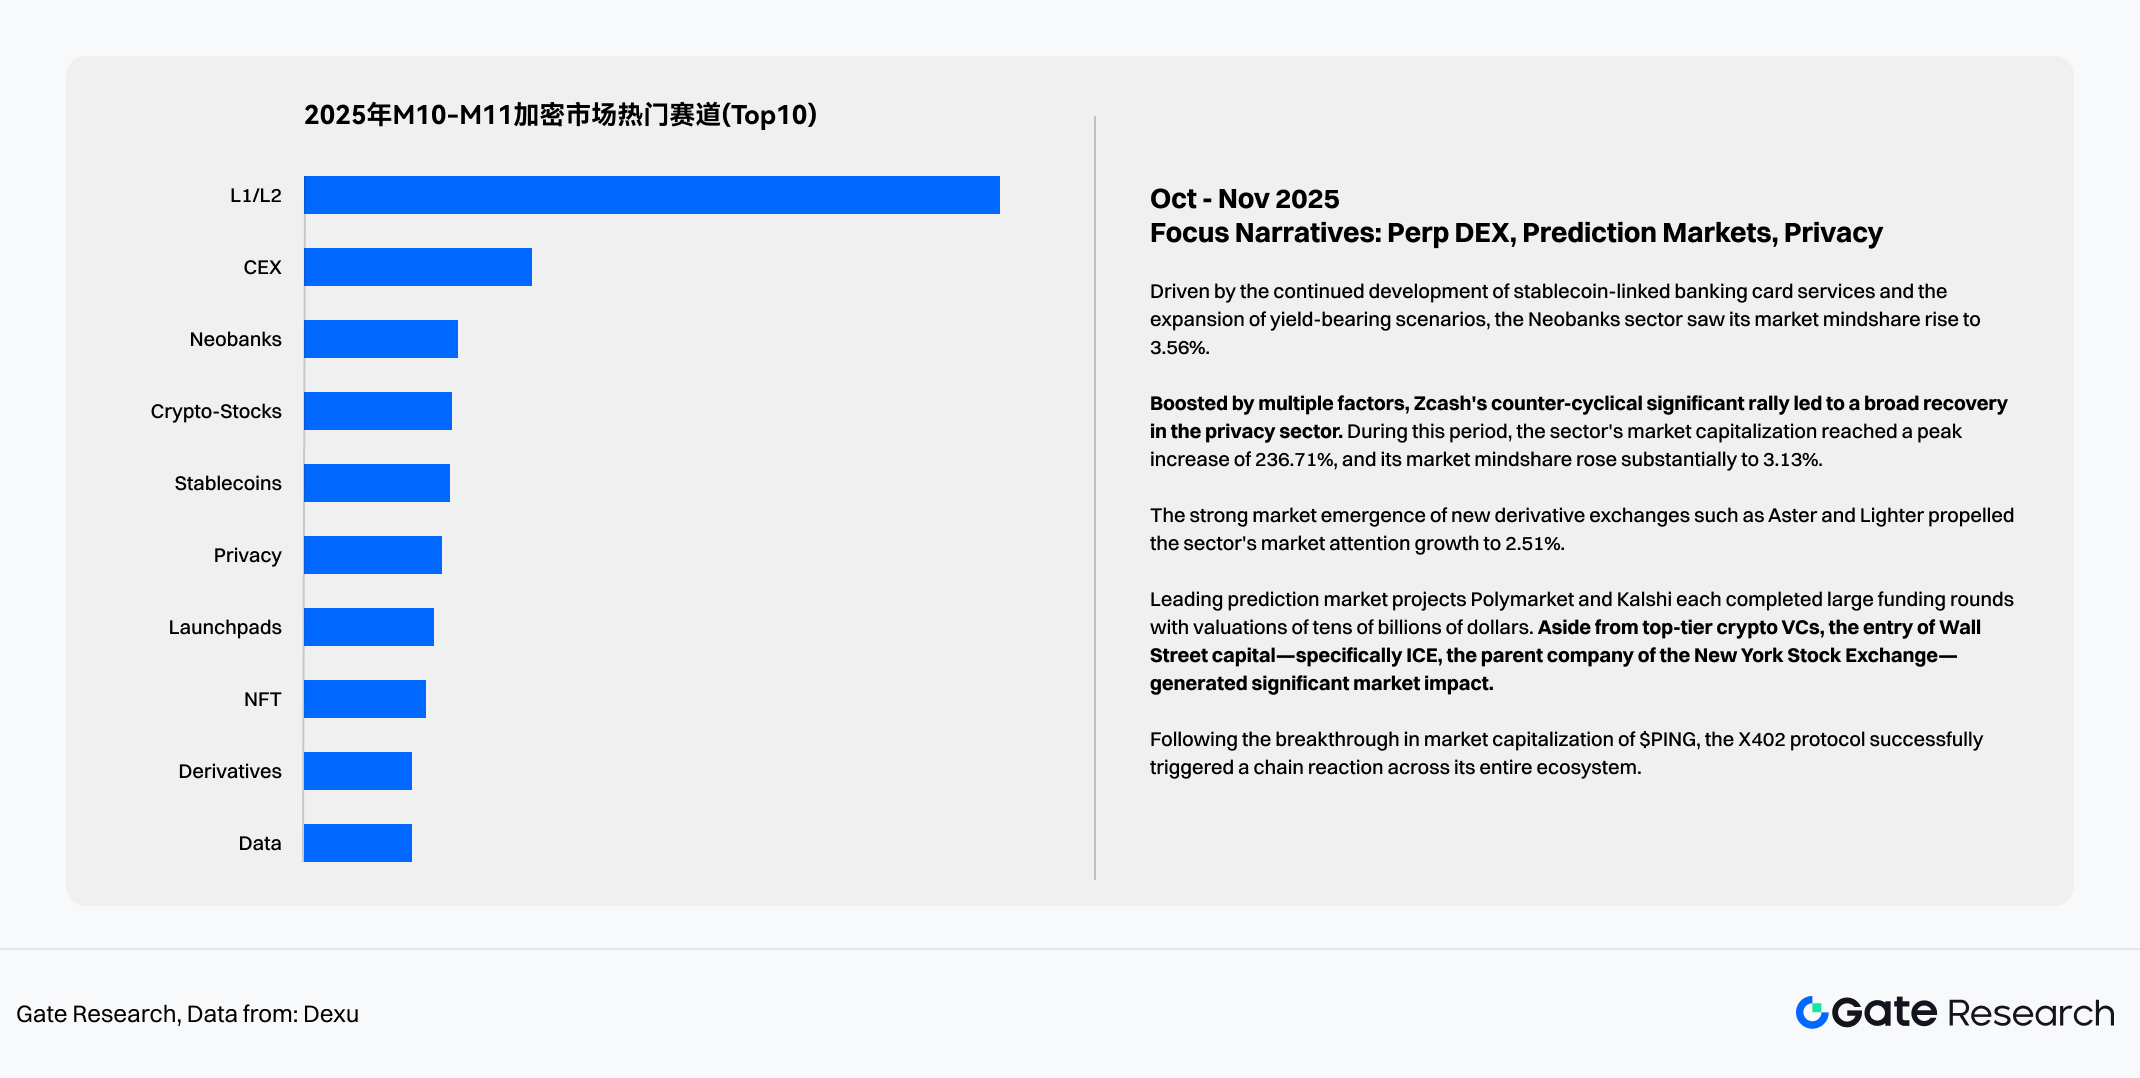
Chart 24: Top 10 Crypto Sectors in M10-M11 2025
Data Source:Dexu
III. Secondary Market: Market Structure and Trading Structure
Data cutoff for this chapter: Research report data as of November 11, 2025; Post-October 11 market data as of November 17, 2025; Memecoin-related data as of November 12, 2025; Statistics for Binance Alpha airdrop listed projects as of November 11, 2025.
1. Annual Overview: Surface “Sideways,” Underlying High Volatility and Multiple Structural Shifts
In 2025, influenced by factors such as macro expectations and policy changes, the crypto secondary market exhibited obvious high volatility and structural changes.
Total Market Cap decreased from $3.4T at the beginning of the year to the current $3.38T (as of Nov 17). While seemingly a slight pullback, it experienced an annualized volatility of 44% and multiple quarterly drawdowns exceeding 20%.
- As of Nov 12, BTC and ETH rose 14.57% and 7.9% respectively year-to-date, while Altcoins dropped 25.12% overall.
- As of Nov 17, the market cap dominance of BTC and Stablecoins rose to 58.36% and 8.54%, increasing by 3.72% and 2.7% respectively year-to-date, while ETH and other altcoins’ dominance decreased by 0.31% and 6.2%.
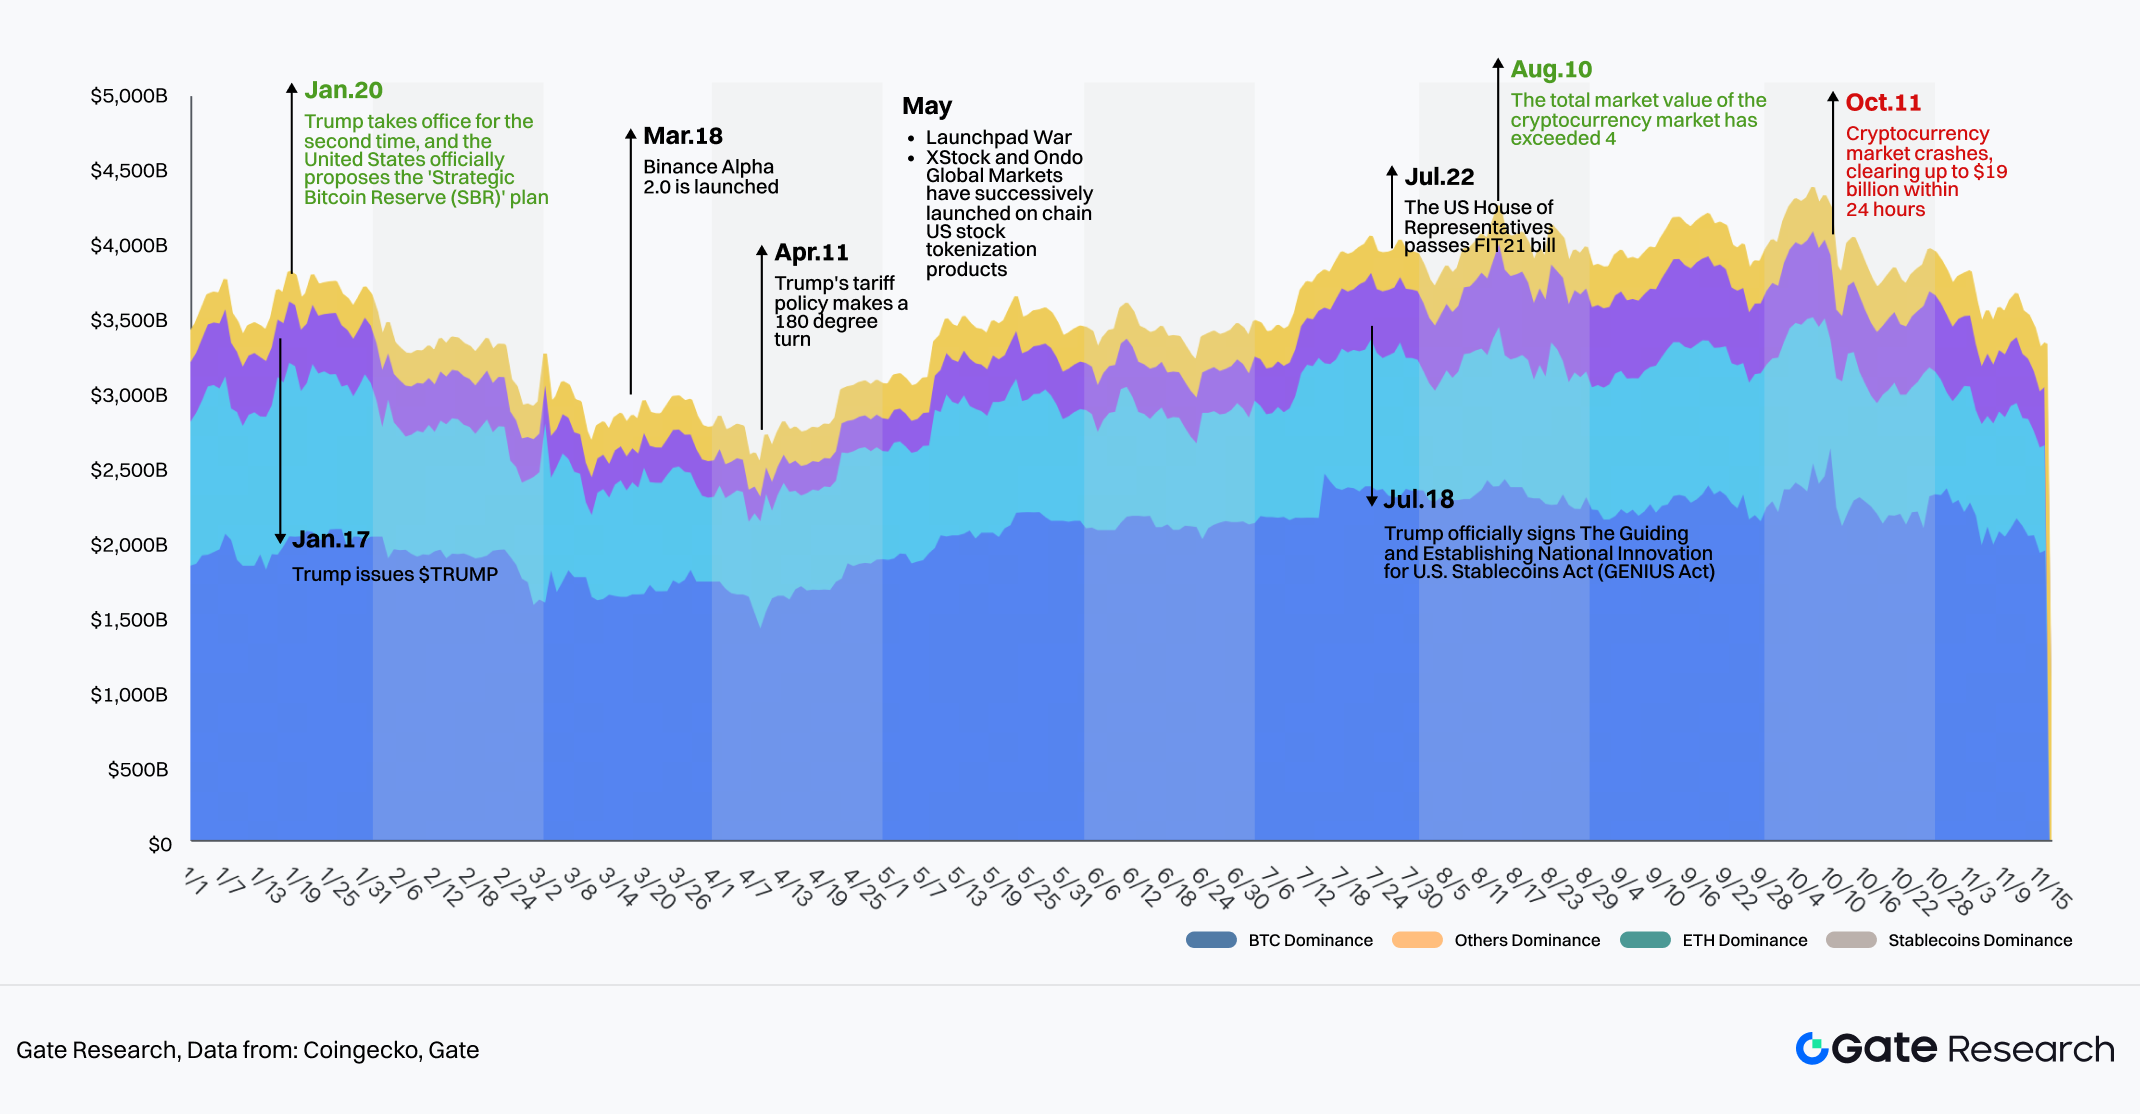
Chart 25: Changes in the Market Value Structure and Key Events of the Cryptocurrency Market in 2025
Data Source: Coingecko, Gate
1.1 Three Major Structural Characteristics of the 2025 Market
1.1.1 Significant Sector Rotation in Altcoins
Privacy, Real World Assets (RWA), and Perpetual sectors performed excellently throughout the year.
- After a general market decline in Q1, decentralized finance (DeFi) sectors like Perpetual, DEX, and Lending led the rise in Q2; in Q3, Layer2, Prediction Market, RWA, and Launchpad sectors performed best; in Q4, the Privacy sector’s rally was unrivaled.
- Overall market capitalization rose by 121.53%, 28.57%, and 10.77% respectively compared to the beginning of the year. Sectors like DePIN, Gaming, Layer2, Memecoin, and AI performed poorly, all dropping by over 40%.
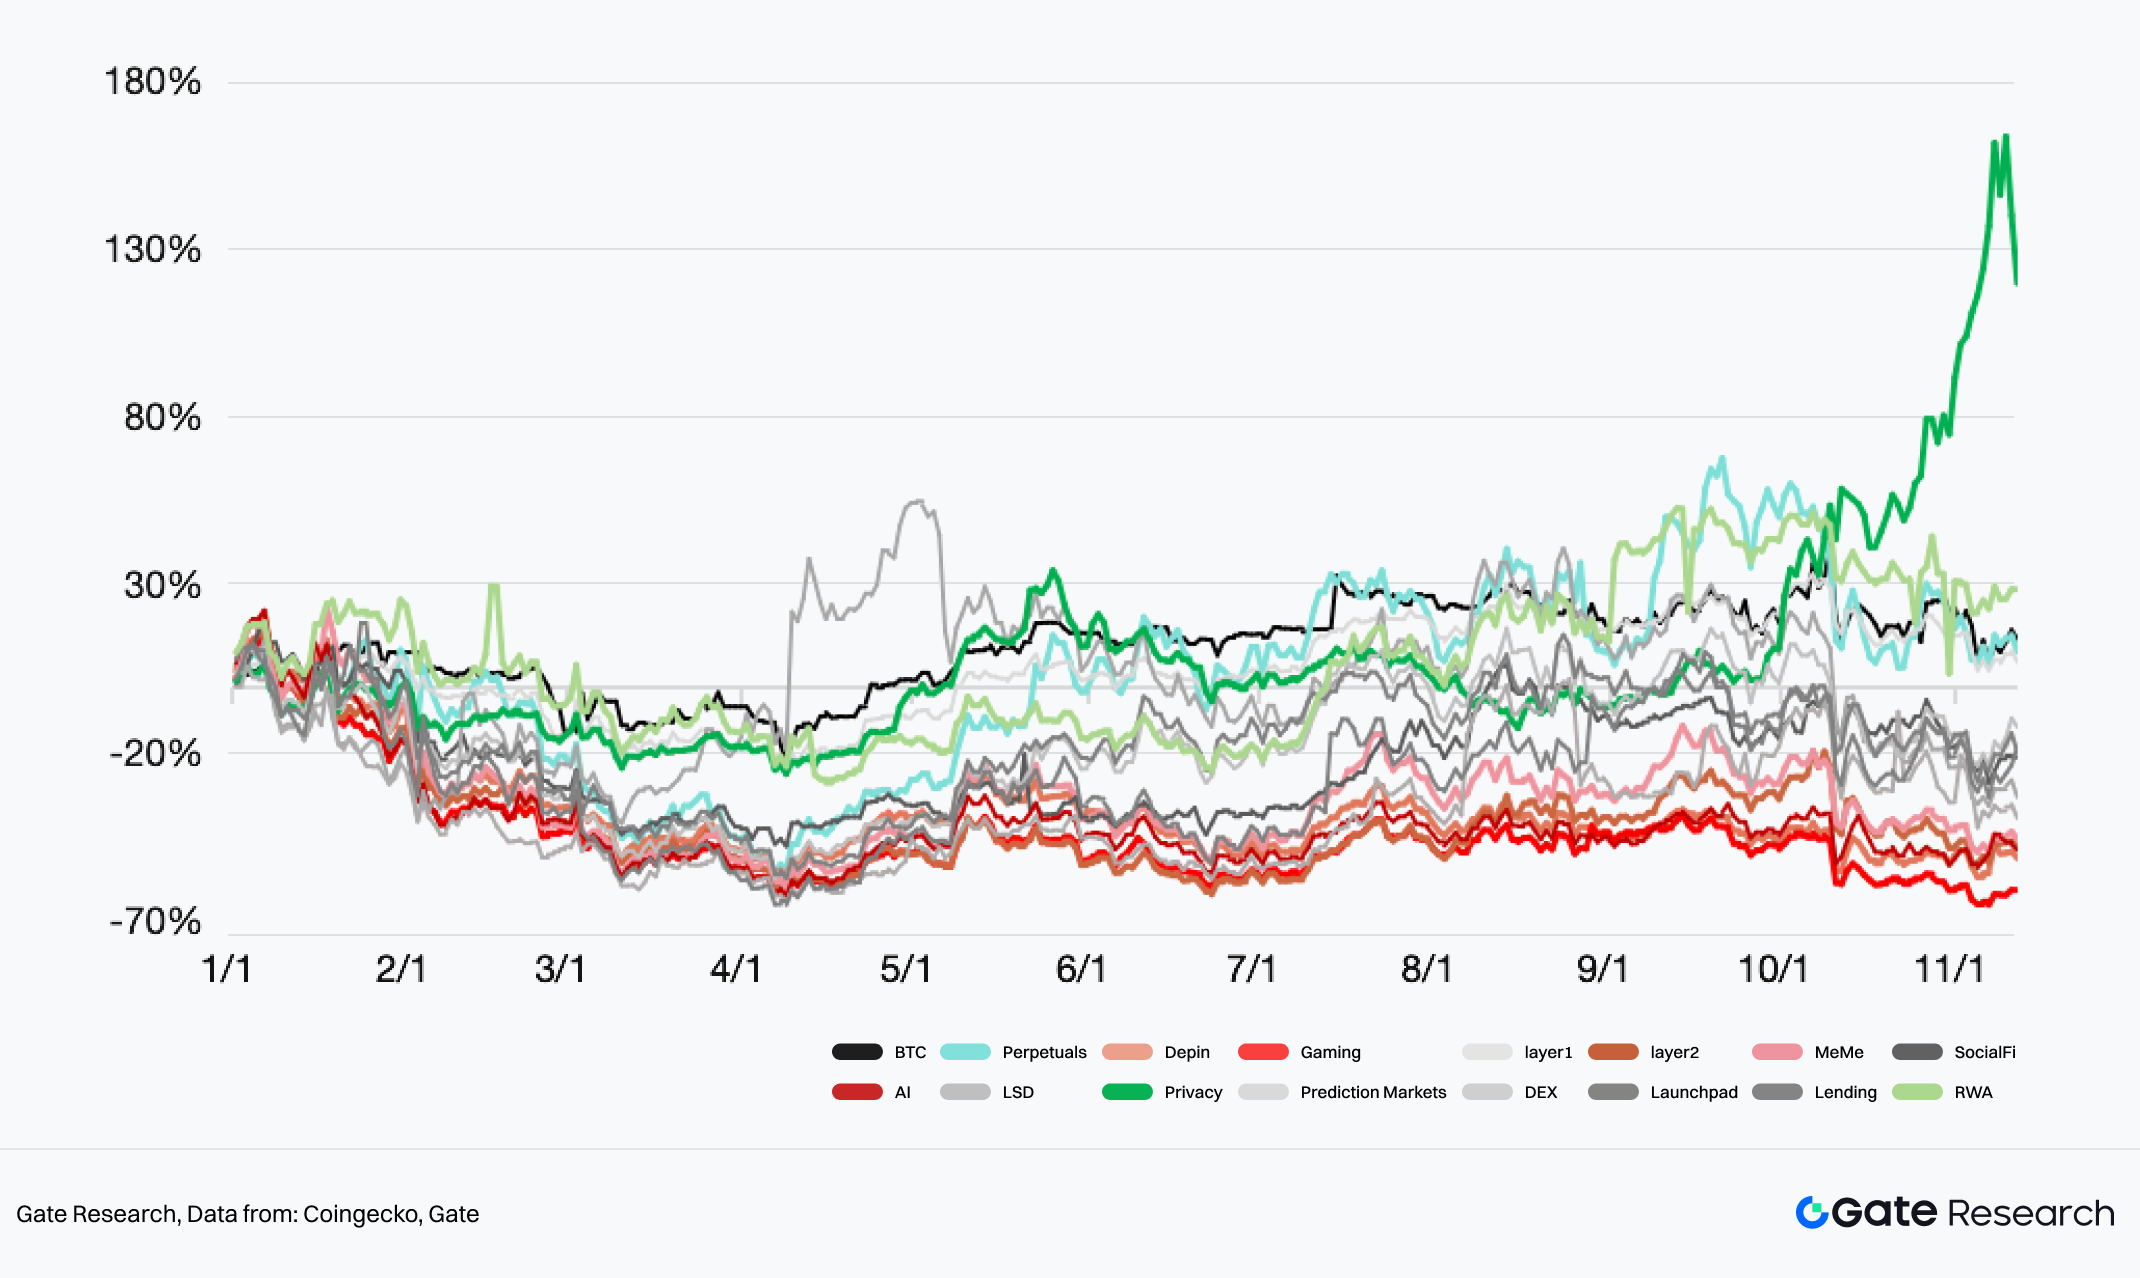
Chart 26: Performance of major tracks in the cryptocurrency market in 2025 (Daily return rate)
Data Source: Coingecko, Gate
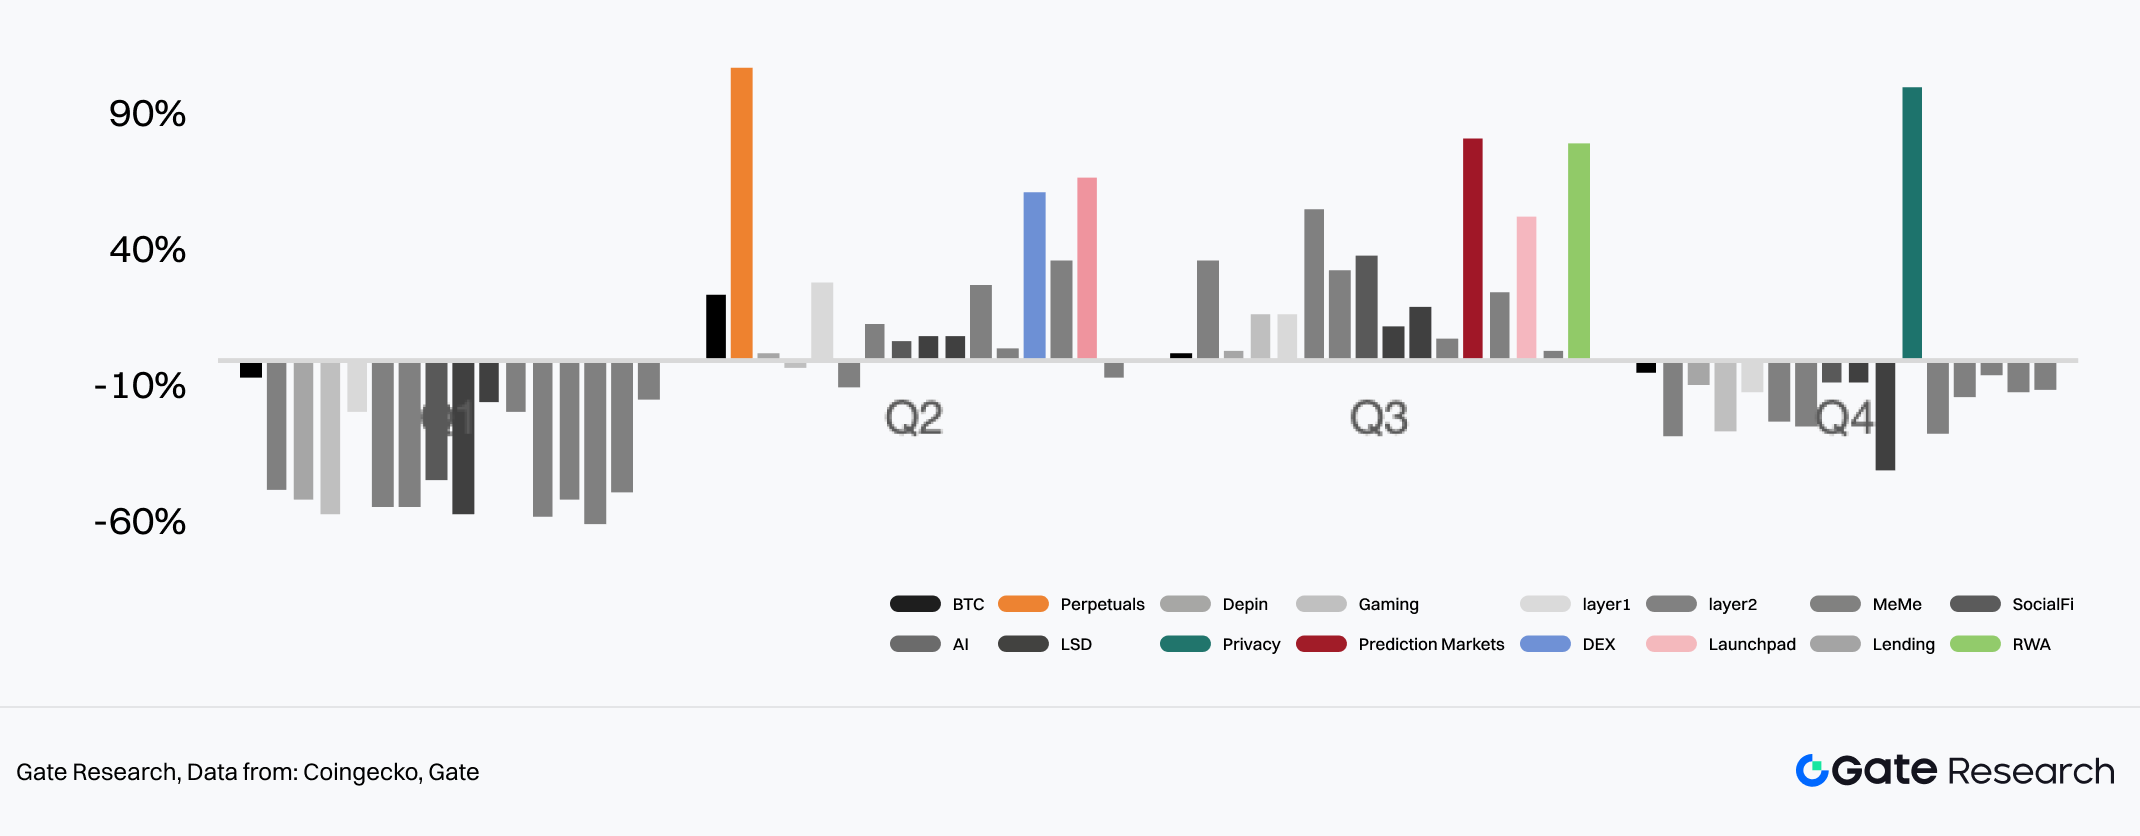
Chart 27: Performance of major tracks in the cryptocurrency market in 2025 (Quarterly return rate)
Data Source: Coingecko, Gate
1.1.2 Accelerated Integration of Crypto and Traditional Finance
Since 2025, the positive correlation between BTC price trends and US stocks has become increasingly obvious, and the mechanism for traditional capital inflow into crypto has been established and is trending towards scale.
- In 2025, the correlation of BTC price trends with QQQ (Nasdaq 100) and SPY (S&P 500) remained positive for long periods, reaching a strong correlation coefficient of 0.8 multiple times, a significant change from the cyclical positive/negative fluctuations in 2024.
- Since the approval of US BTC Spot ETFs, crypto assets purchased by US Spot ETFs have continued to rise. As of Nov 2025, the total net assets of US Spot ETFs reached around $150B. With more token ETFs gradually approved, more traditional funds will enter the crypto market, tightening the link between crypto and traditional financial markets.
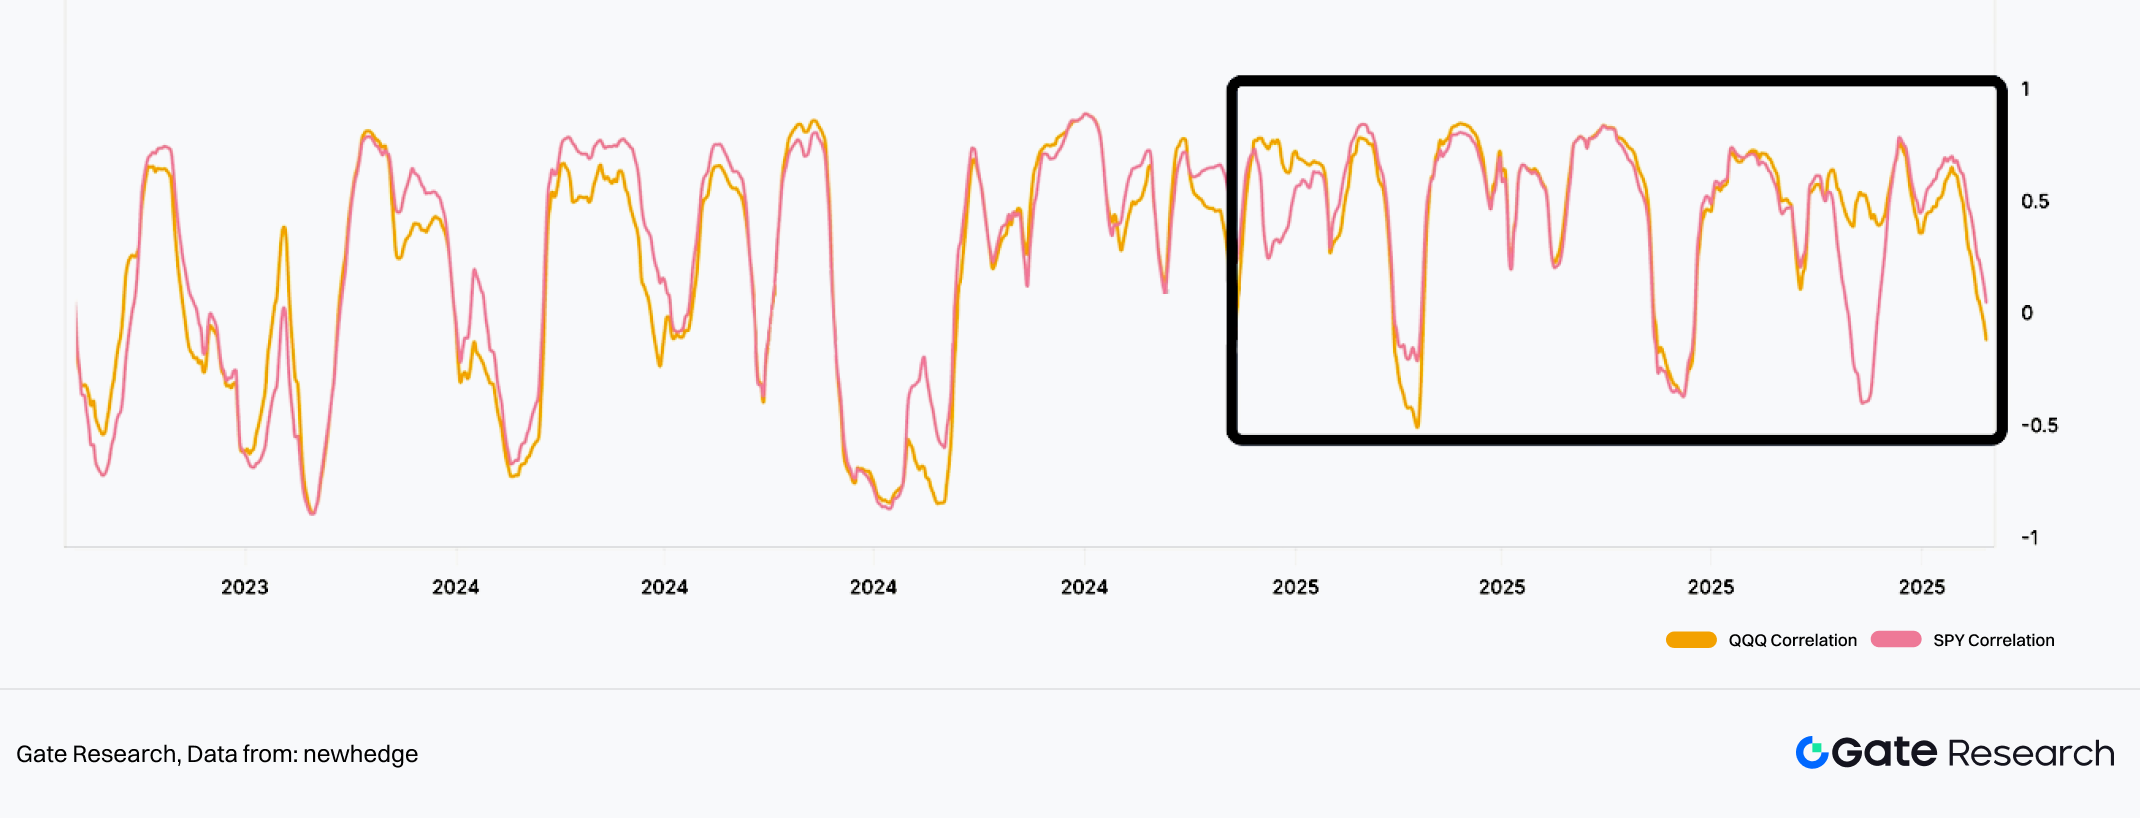
Chart 28: Bitcoin Correlations (QQQ, SPY)
Data Source: newhedge
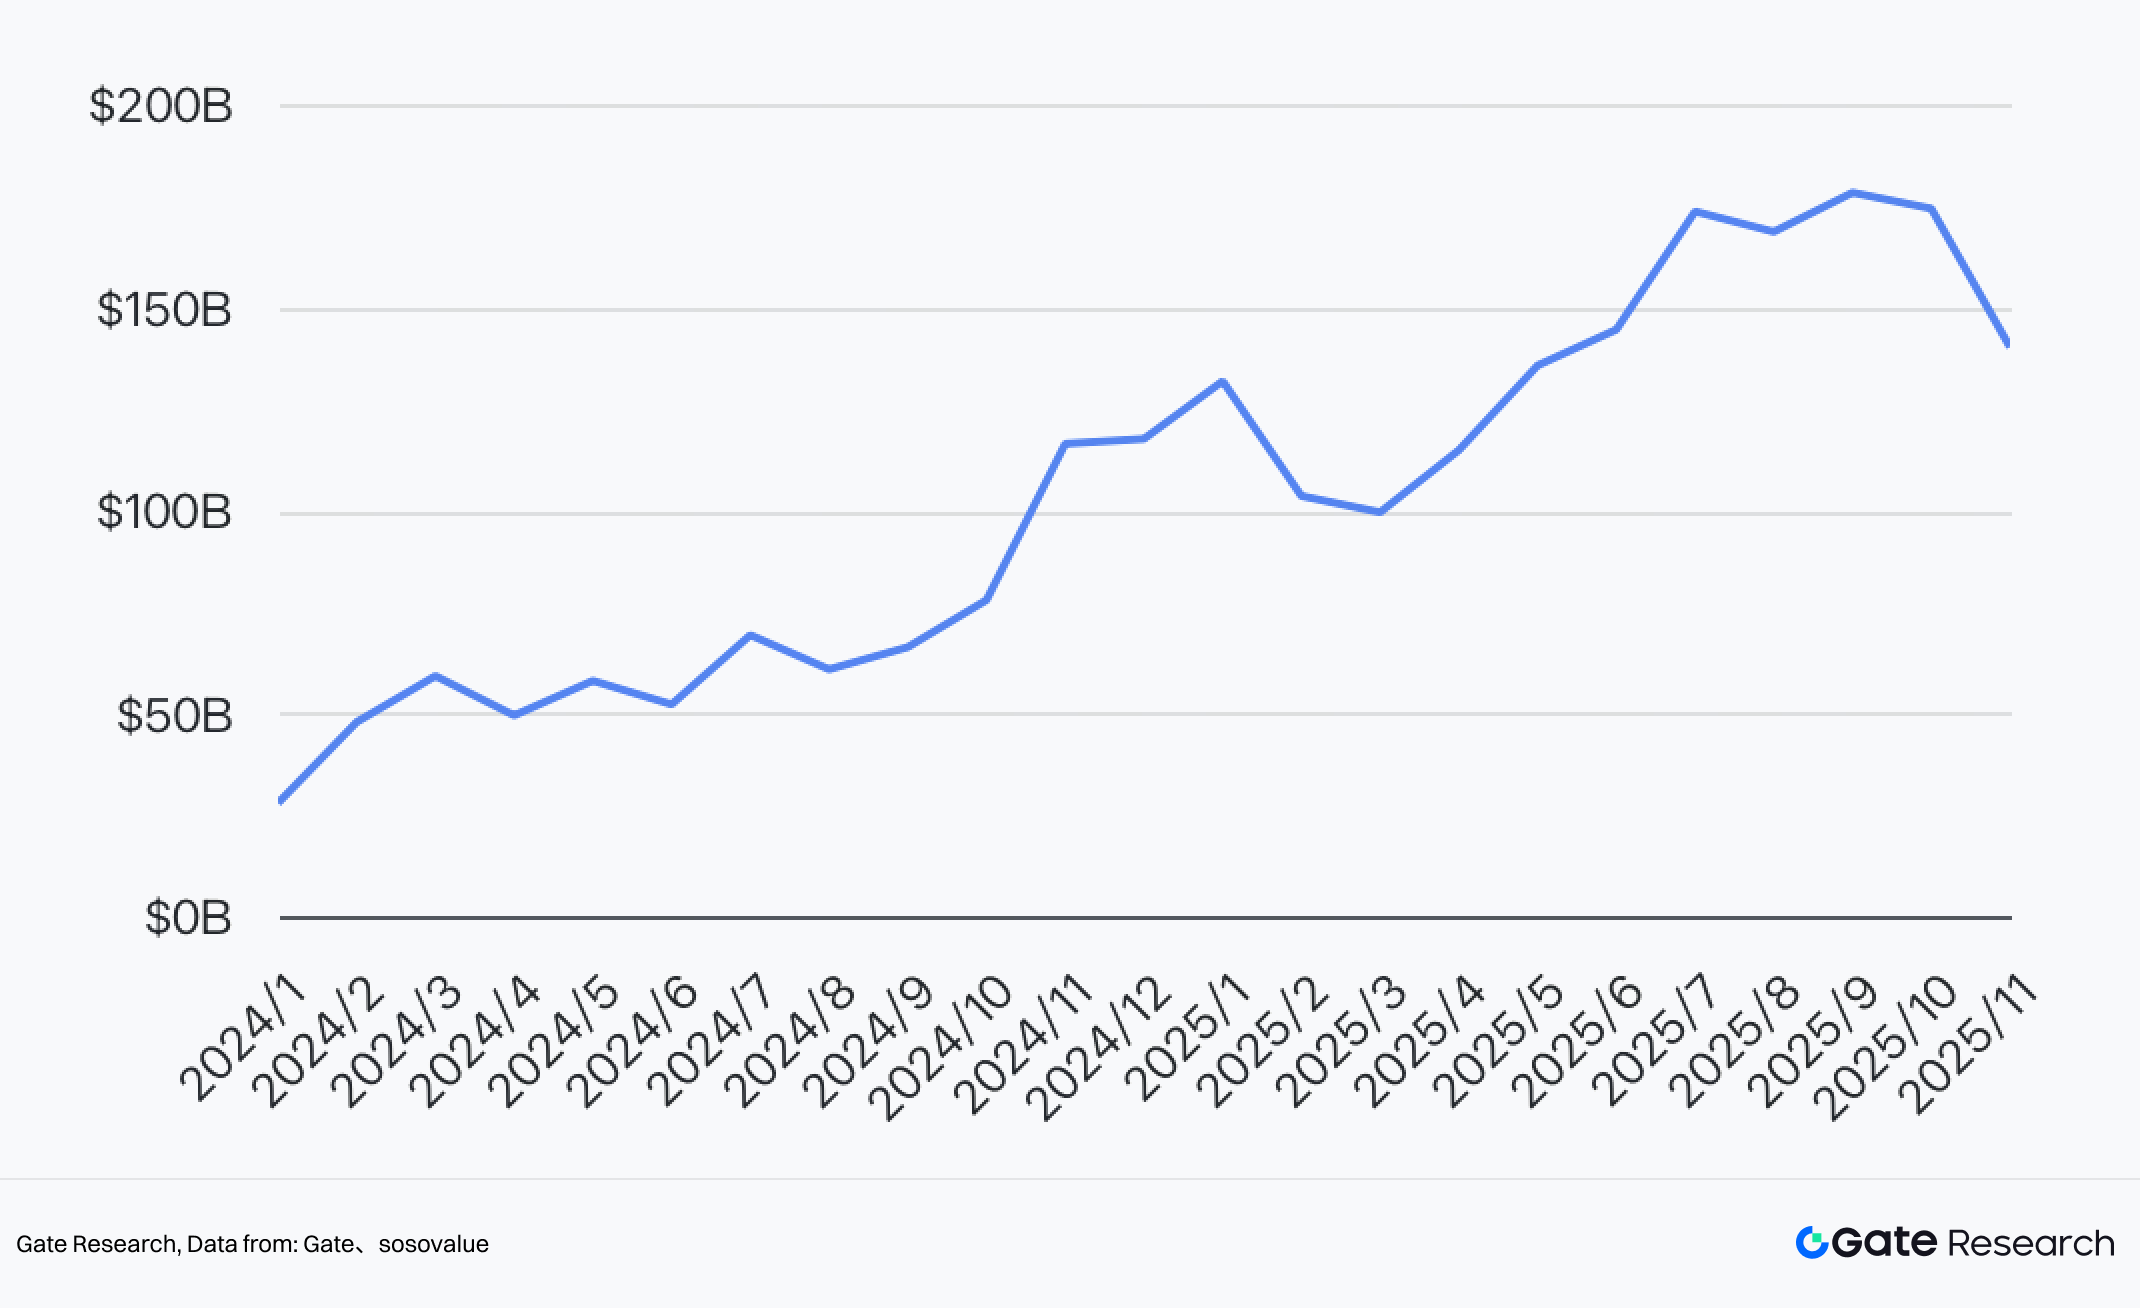
Chart 29: Net Assets of U.S. Spot ETFs: BTC, ETH, SOL, and XRP
Data Source: Sosovalue, Gate
1.1.3 The New Normal of Contract-Dominated Trading
In 2025, the average monthly daily trading volume (Spot + Futures) was $11.2T, with futures trading volume accounting for an average of 62.32% of the total. This represents a 2.13% increase from the beginning of the year.
Since early March, the share of futures trading volume continued to rise from an average of 56.5% in January to 67.65% in June. Although it began a fluctuating downward trend after June, it basically remained around 55%.
With increased market volatility and divergent investor behavior, market trading strategies gradually shifted to contracts (futures) to capture short-term opportunities rather than holding spot long-term.
- From Jan-Mar, the crypto market trended downward overall, BTC volatility increased significantly, and investor behavior diverged. Spot trading volume showed negative growth in all months except May, while futures trading volume rose steadily.
- After July, as regulatory trends and rate cut expectations became clearer, market volatility continued to decline. Spot demand began to grow, with transaction volume month-on-month growth rates gradually exceeding contracts, and the proportion of futures trading volume showed a downward trend.
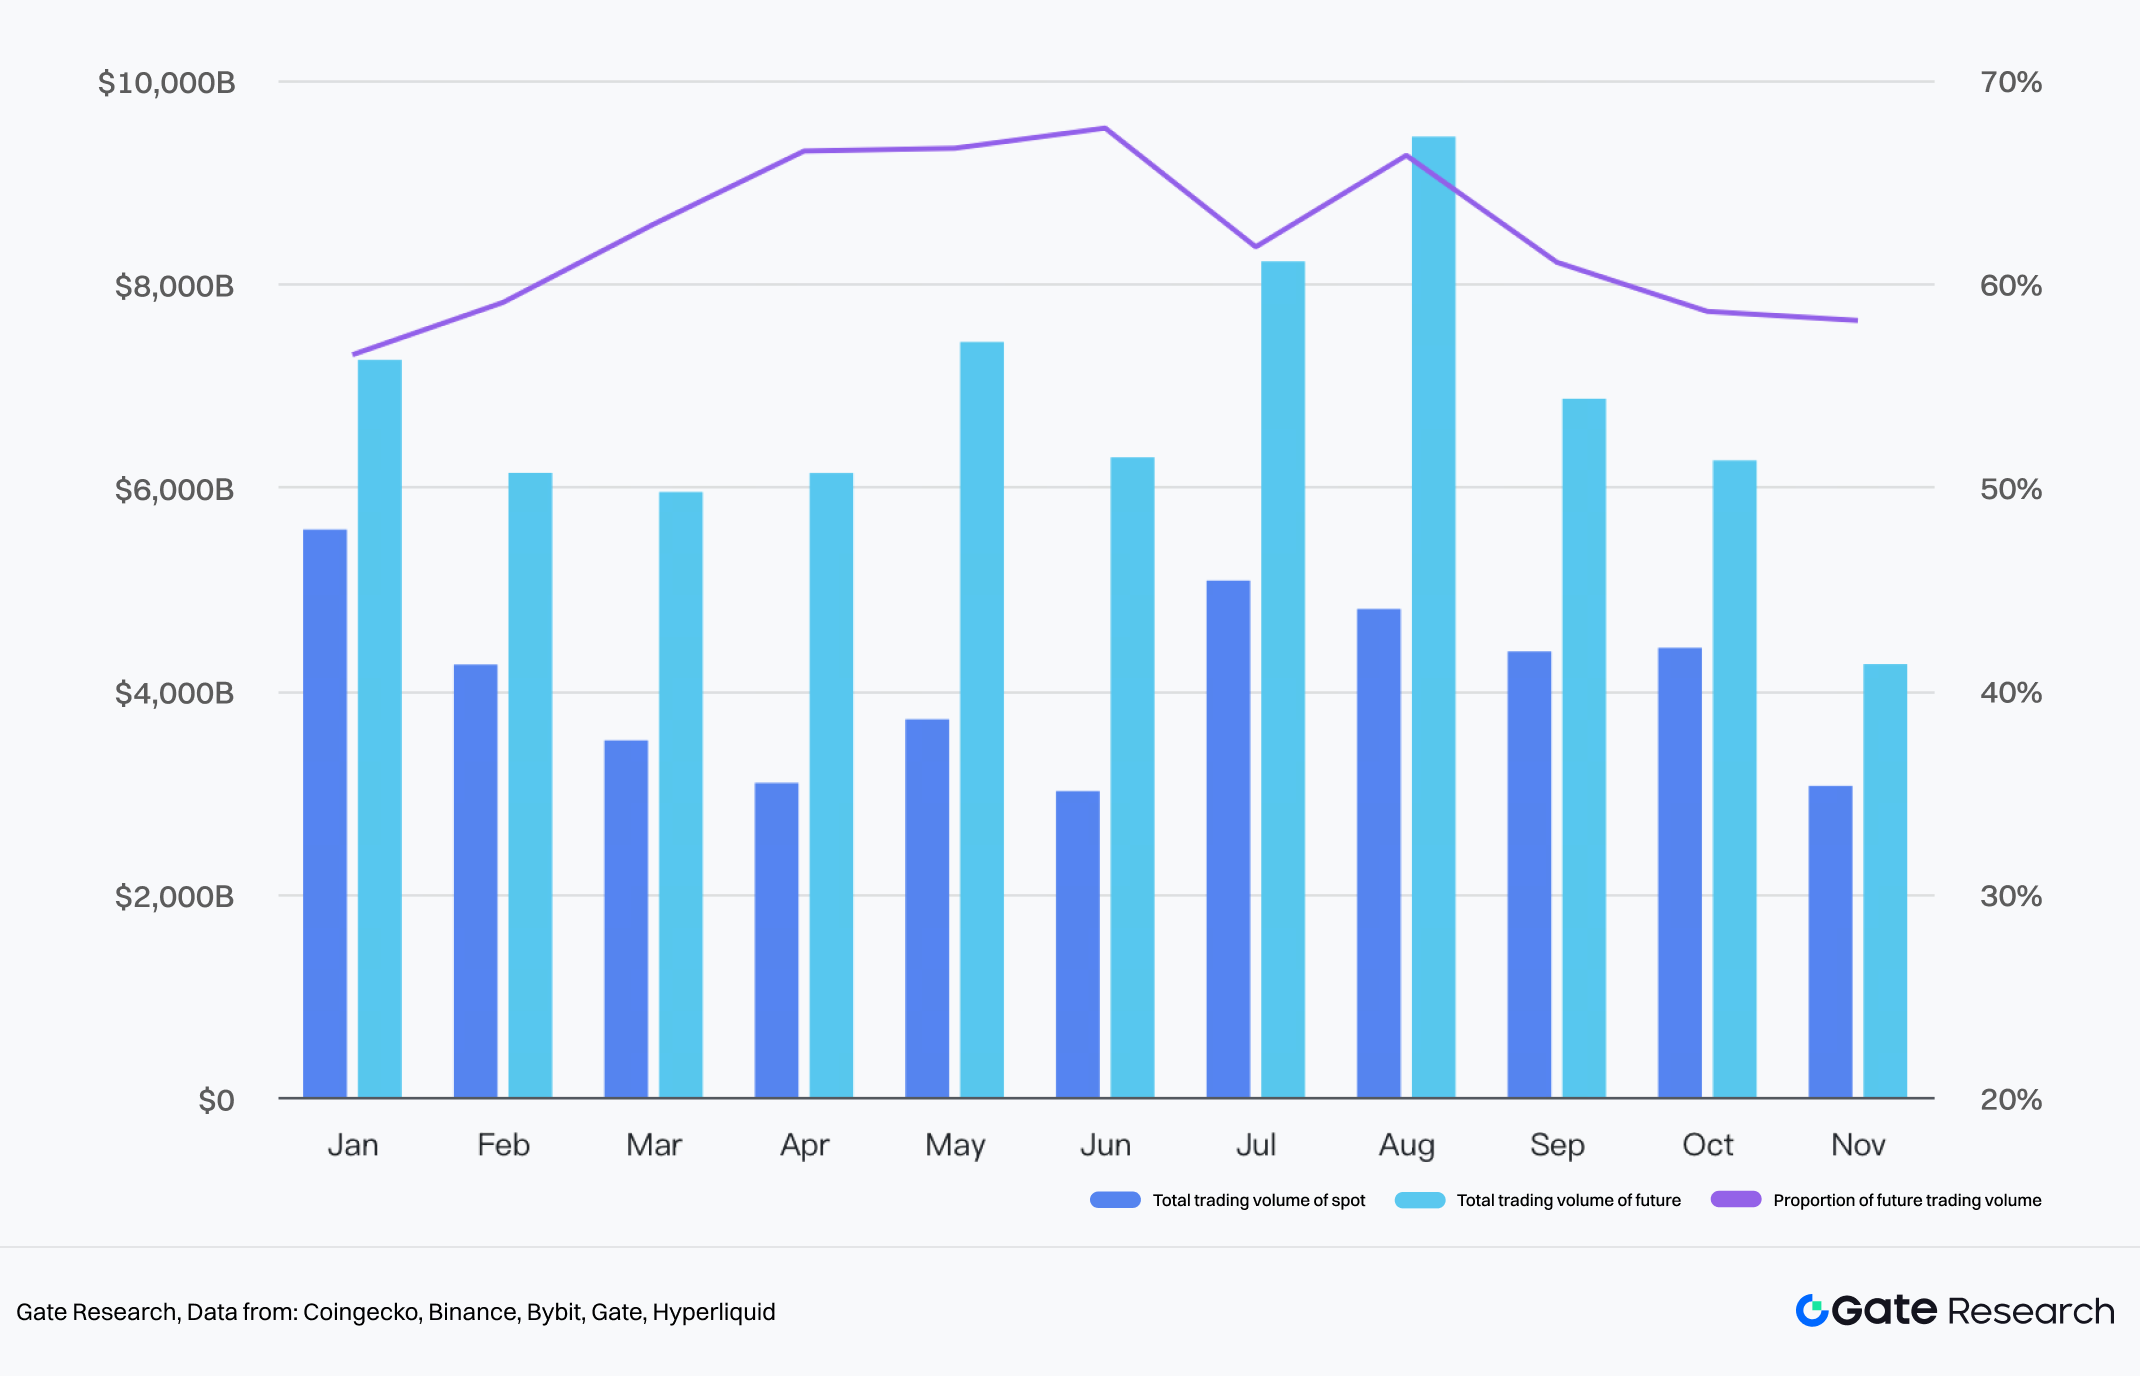
Chart 30: Total trading volume of the cryptocurrency market in 2025
Data Source: Coingecko(Contract trading volume data primarily selected from major exchanges such as Binance, Bybit, Gate, and Hyperliquid)
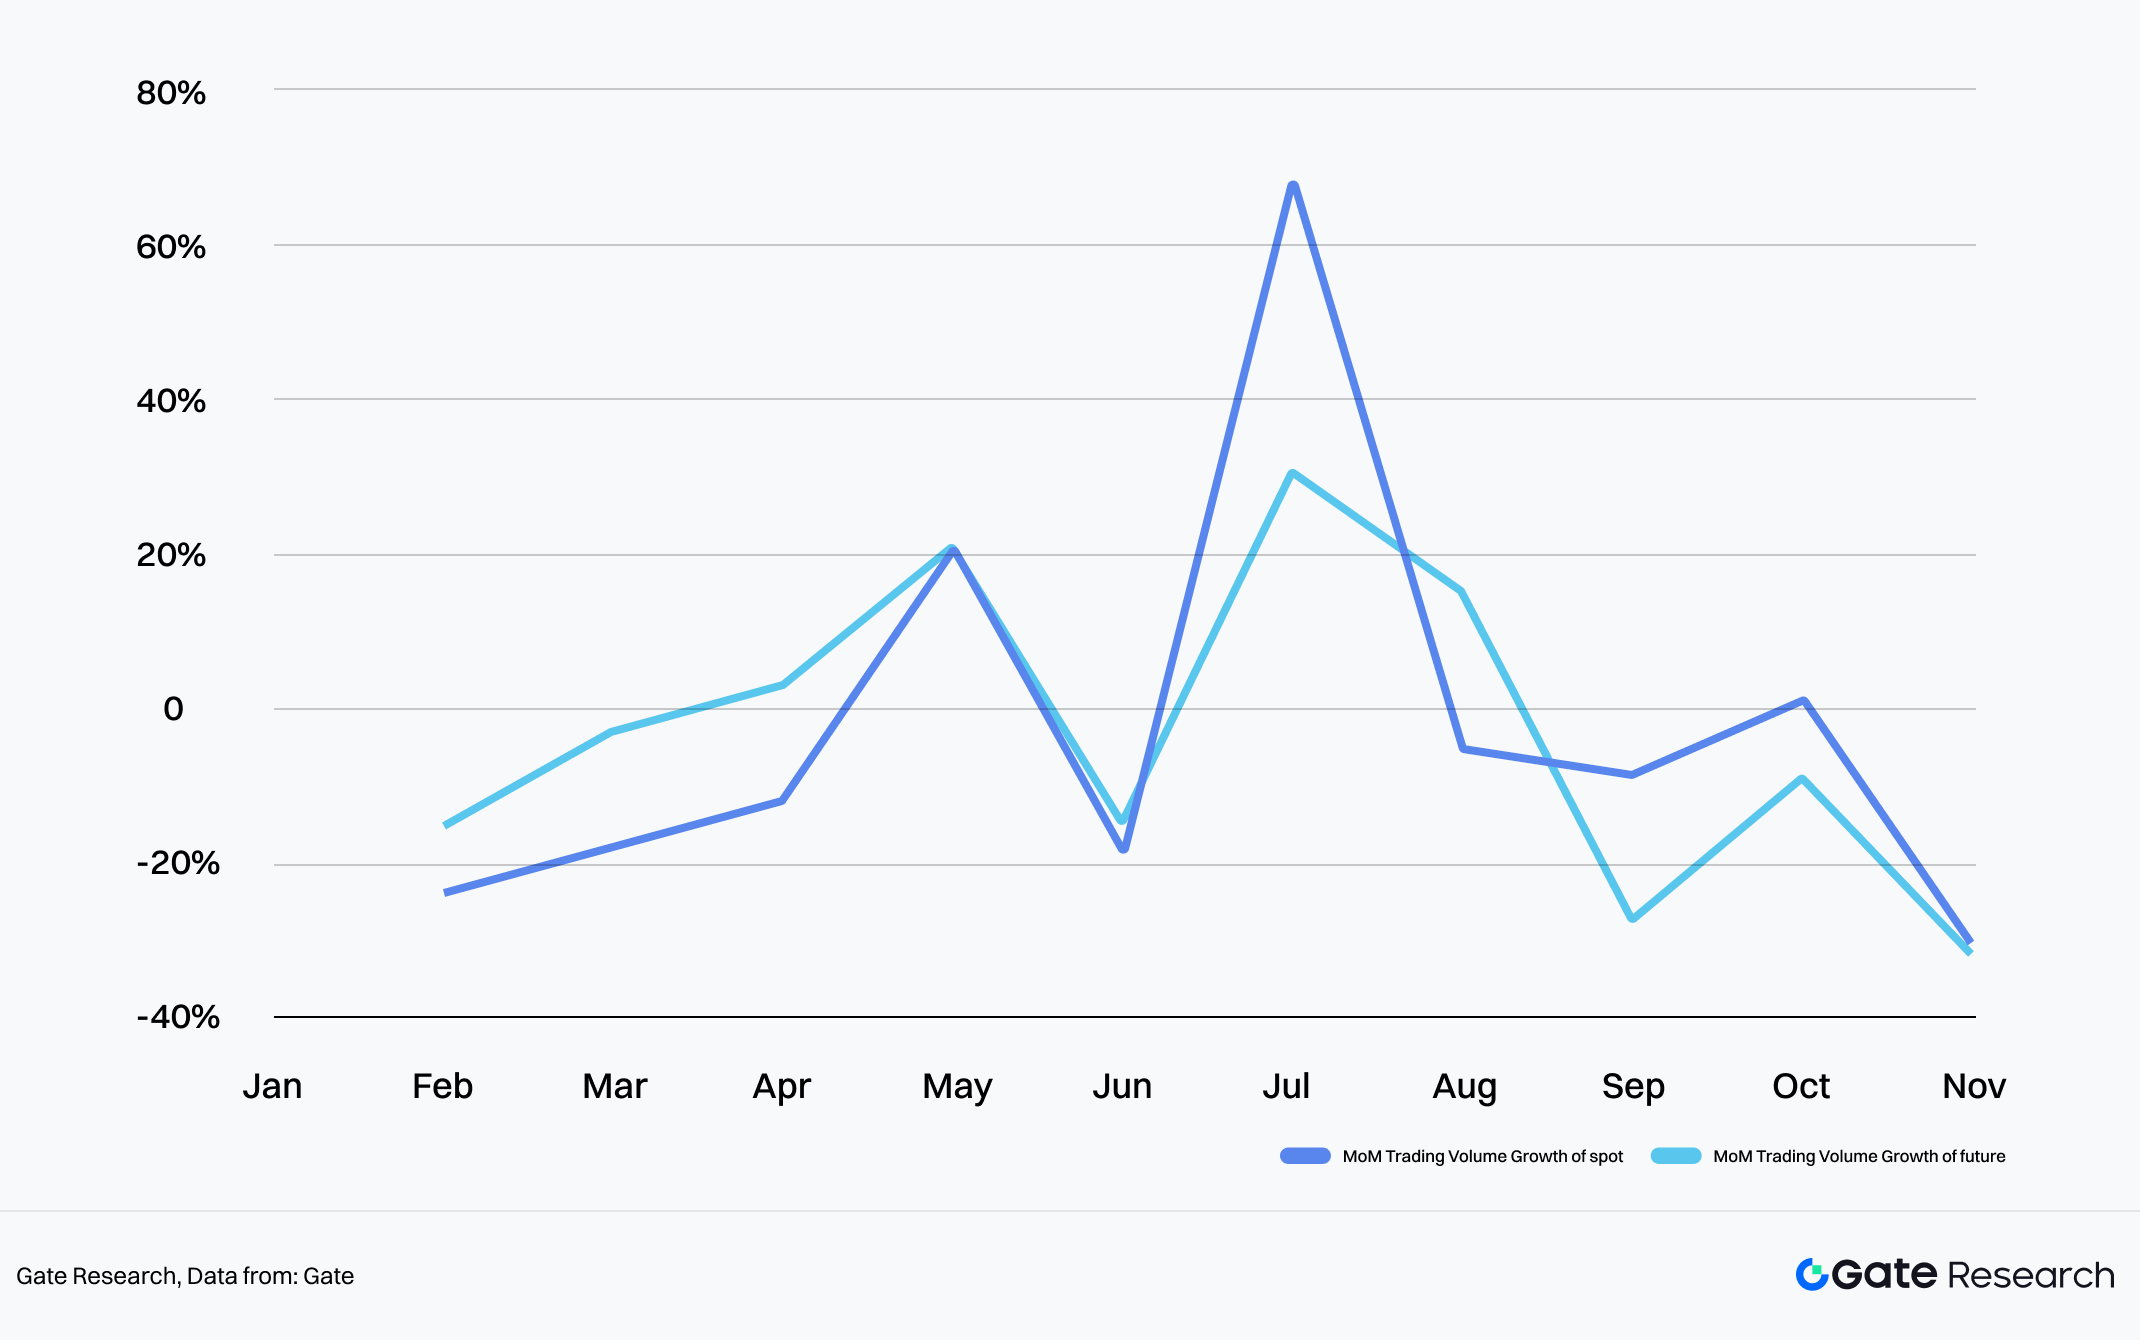
Chart 31: MoM Trading Volume Growth of spot and future trading volume in 2025
Data Source: Coingecko, Gate
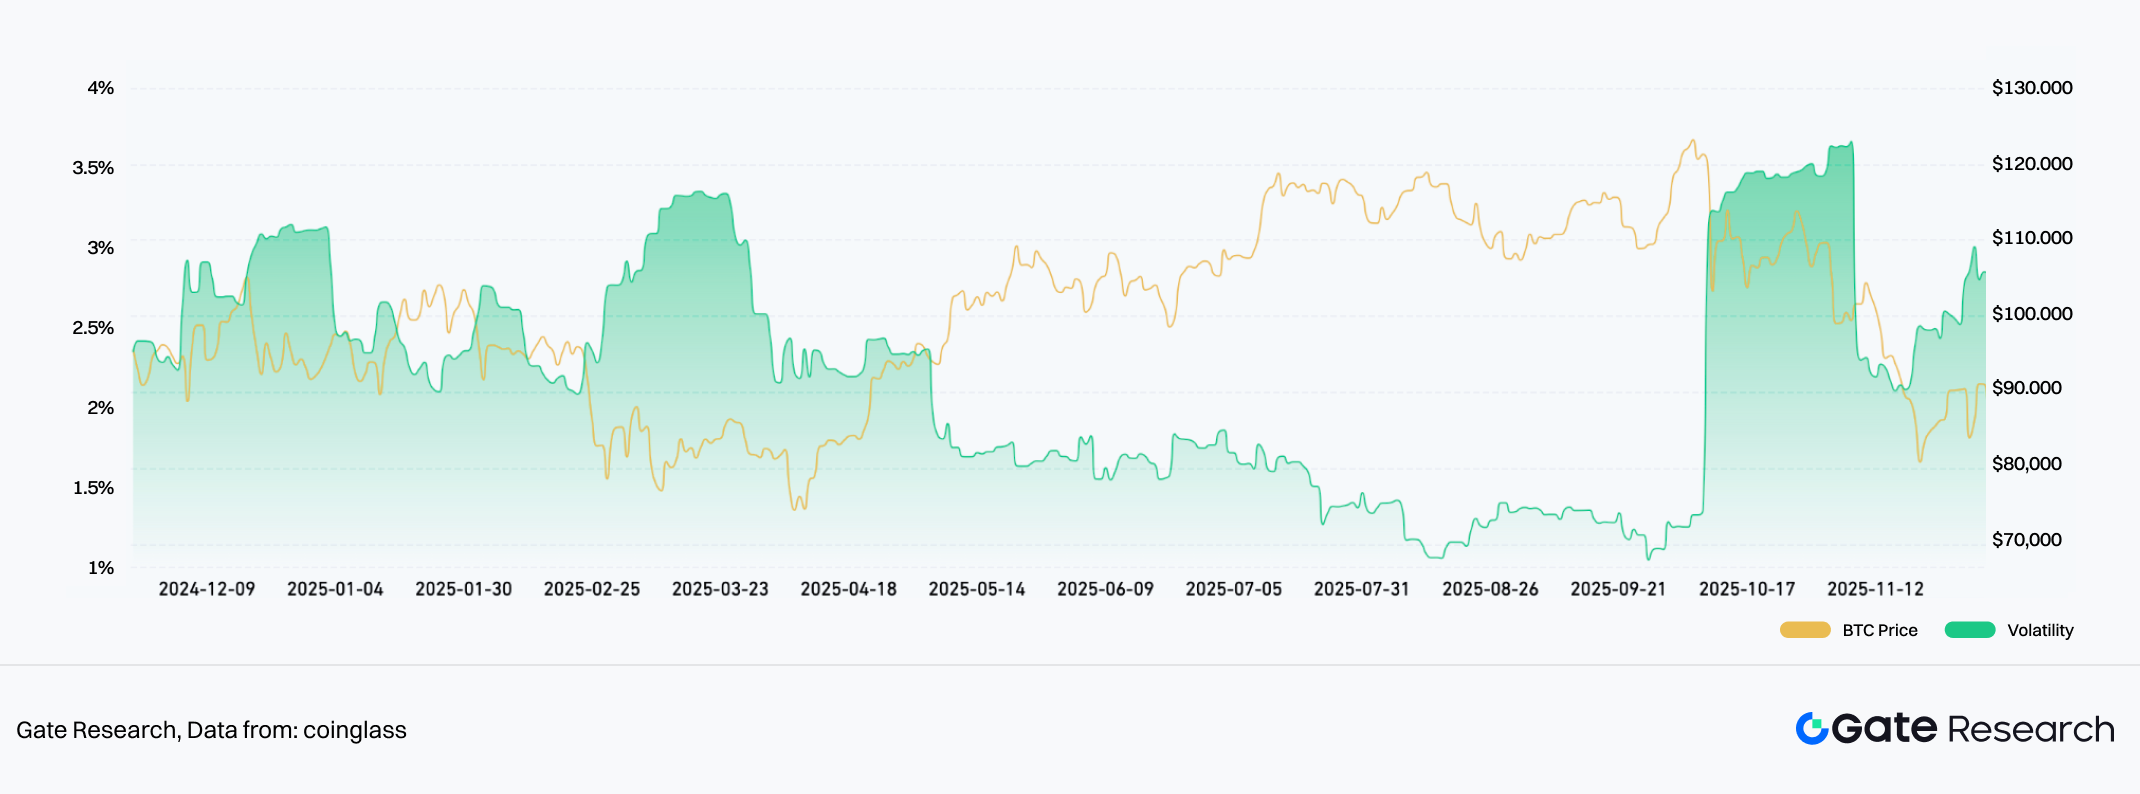
Chart 32: BTC Historical Volatility
Source From:Coinglass
1.2 2025 Secondary Market Review: Evolution from Macro Narrative to Structural Integration
2025 Q1: Macro Tightening and Policy Uncertainty Trigger Sharp Market Drop
Early in the year, the Fed’s pause on rate cuts and the Trump administration’s restart of tariffs triggered a global liquidity and supply chain crisis. The total crypto market cap fell sharply from a high of $3.8T, with a maximum drop of over 30%.
- US President Trump launching a personal token sparked a celebrity token issuance craze, rapidly draining market liquidity.
- Altcoins were the first to correct, with market share dropping from a high of 32.35% to 20.43%.
- Safe-haven and highly liquid assets became dominant, with BTC share rising to 60%+ and stablecoin scale rising synchronously.
- Binance launched Alpha 2.0, gradually influencing the market landscape deeply.
2025 Q2: Fed Rate Cut Expectations Return, Trump Tariff Policy Softens, Market Shifts from Rising Volatility to Steady Recovery
The Fed’s “dovish” signals reignited liquidity expectations, and Trump’s 180-degree turn on tariff policy was seen as a macro directional easing signal, becoming a turning point for market sentiment. The crypto market began a steady recovery, with a maximum quarterly gain of over 45%.
- BTC, ETH, and stablecoin market caps recovered steadily.
- DeFi led the market, with Perpetual and Lending sectors rising 104.5% and 65.2% respectively.
- The RWA ecosystem was poised for action, with Ondo & Xstock on-chain stocks emerging.
- Memecoins on Sol, BSC, etc., heated up again, with the Launchpad sector rising over 35.23%.
2025 Q3: Fed Rate Cut Imminent, Crypto Market Structural Trend Confirmed
With the Fed rate cut imminent, the market structural trend was confirmed. Total market cap broke $4T, reaching the year’s highest point.
- BTC and ETH prices both hit historical highs. ETH led the market.
- ETH Spot ETF inflows exceeded BTC, with a net inflow of $9.58B in a single quarter. Massive buying by coin-stock companies like SharpLink and BitMine pushed ETH’s market share to 12.61%.
- The RWA sector exploded, rising 77.26% in a single quarter. On-chain US stocks and bonds formed a real yield asset pool, and stablecoin market cap broke $28B.
- On-chain Perpetual dominance strengthened, with Hyperliquid trading volume market share continuing to grow.
2025 Q4: Market Flash Crash Triggers Leverage Clearing, Accelerated Integration of Crypto and TradFi
On October 11, the market flashed crashed, with a 24-hour liquidation scale reaching $19B. High leverage positions were wiped out en masse, and market cap fell back to the current (Nov 17) $3.28T, entering a downward channel.
- The market entered a defensive phase of low liquidity; mainstream token market depth and OI holdings both showed significant declines.
- The 30-day correlation between BTC and the Nasdaq 100 Index remained highly positive, tightening the link between crypto and traditional financial markets.
- The Privacy sector began a sustained rise from late September and accelerated after the Oct 11 flash crash, with YTD highs exceeding 150%.
2. Deep Dive into Key Events: Viewing Overall Logic through Local Changes
2.1 From Frenzy to Cooling: Memecoin Sector Shows Zero-Sum Game After Wealth Effect Fades
At the beginning of the year, the AI Memecoin craze combined with US President Trump’s token issuance attracted a massive influx of new users and funds due to the huge wealth effect and exposure. However, the subsequent sharp drop cooled the market rapidly.
In May, intense competition among Launchpads primarily on the Sol chain (Pump.fun, bonk.fun, Believe) birthed high-market-cap Memecoins like $USELESS, whose fair participation and wealth effect attracted many investors.
Memecoins currently belong to assets with lower priority in crypto market liquidity preferences, showing poor overall trends.
- As of Nov 12, Memecoin market cap dropped 45.51% from the beginning of the year. After the Q1 crash, rebounds in Q2 and Q3 were very weak.
- Memecoins’ share of total crypto market cap continues to decline, currently only 1.6%, a decrease of 1.46% from the start of the year, with the decline in share significantly exceeding the overall altcoin sector drop.
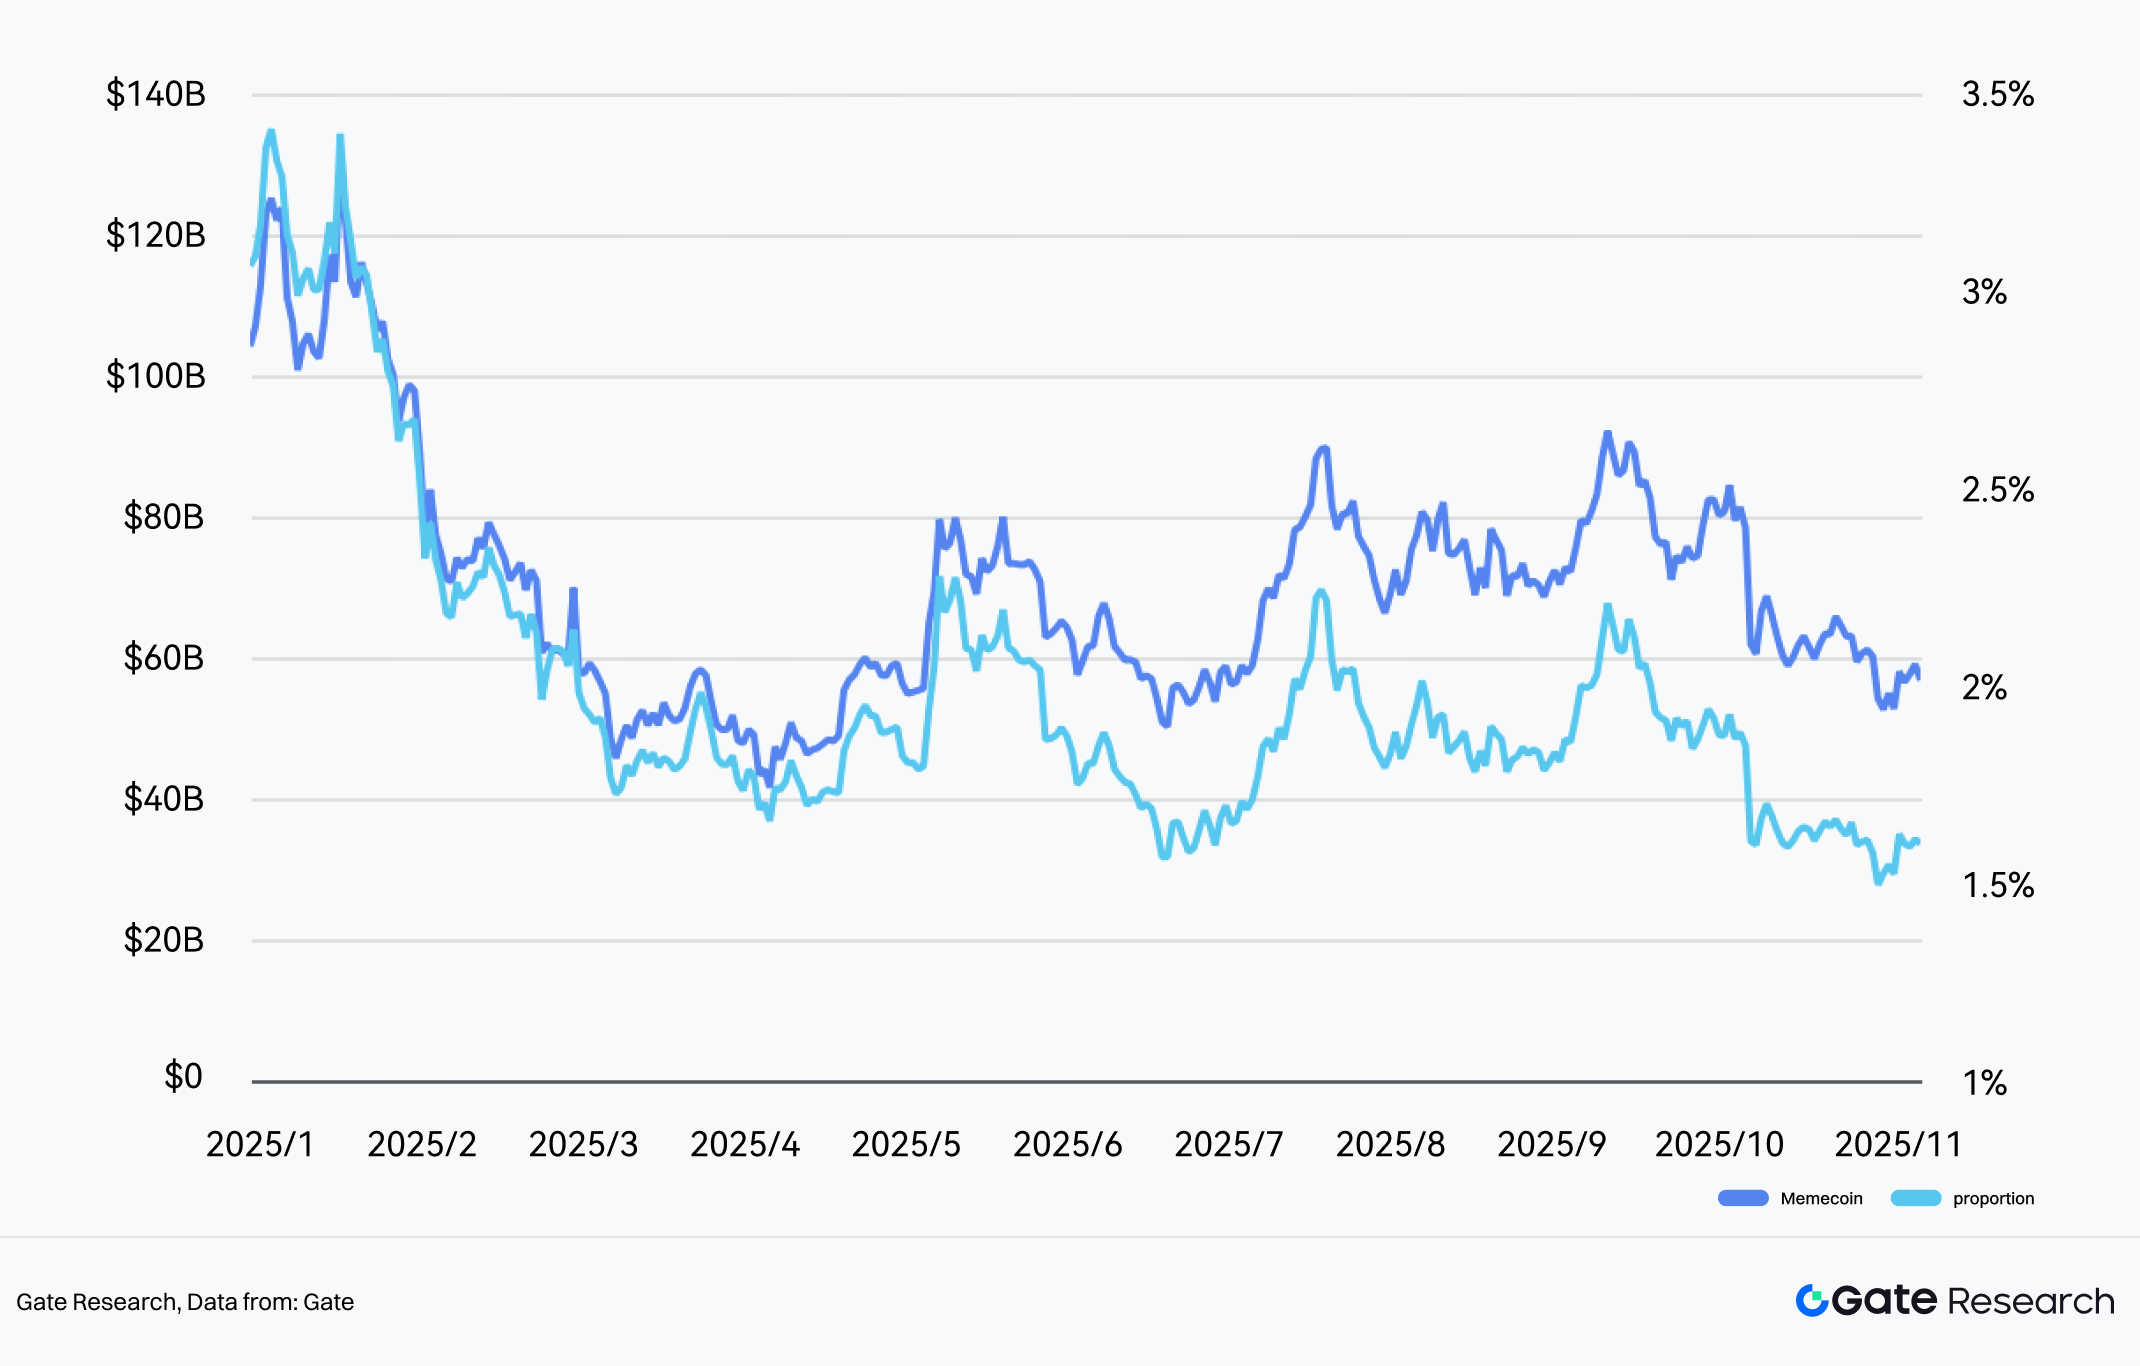
Chart 33: Top Memecoin Market Cap and Percentage of Total Crypto Market Capitalization
Data from:Coingecko, Gate
On-chain speculative demand still exists, but the zero-sum competition is becoming fiercer (using Solana chain data, where Memecoin creation and trading are most active, as a reference).
- Revenue from Solana Launchpads like Pump.fun and Bonk.fun remained around $60M monthly from February to September, except for market crashes in Jan and Oct. Even in Oct, affected by the market drop, it still had $40M. This indicates that on-chain token deployment and trading remain at a decent level.
- Since April, multiple new Solana ecosystem Launchpads like Bonk.fun, Boop, Believe, Moonshot Create, and Jup Studio have emerged, competing fiercely with pump.fun. However, this competition did not bring incremental liquidity to the chain. The trading volume of on-chain DEX Memecoins, the number of New Tokens deployed, and the number of active addresses are all in a fluctuating decline.
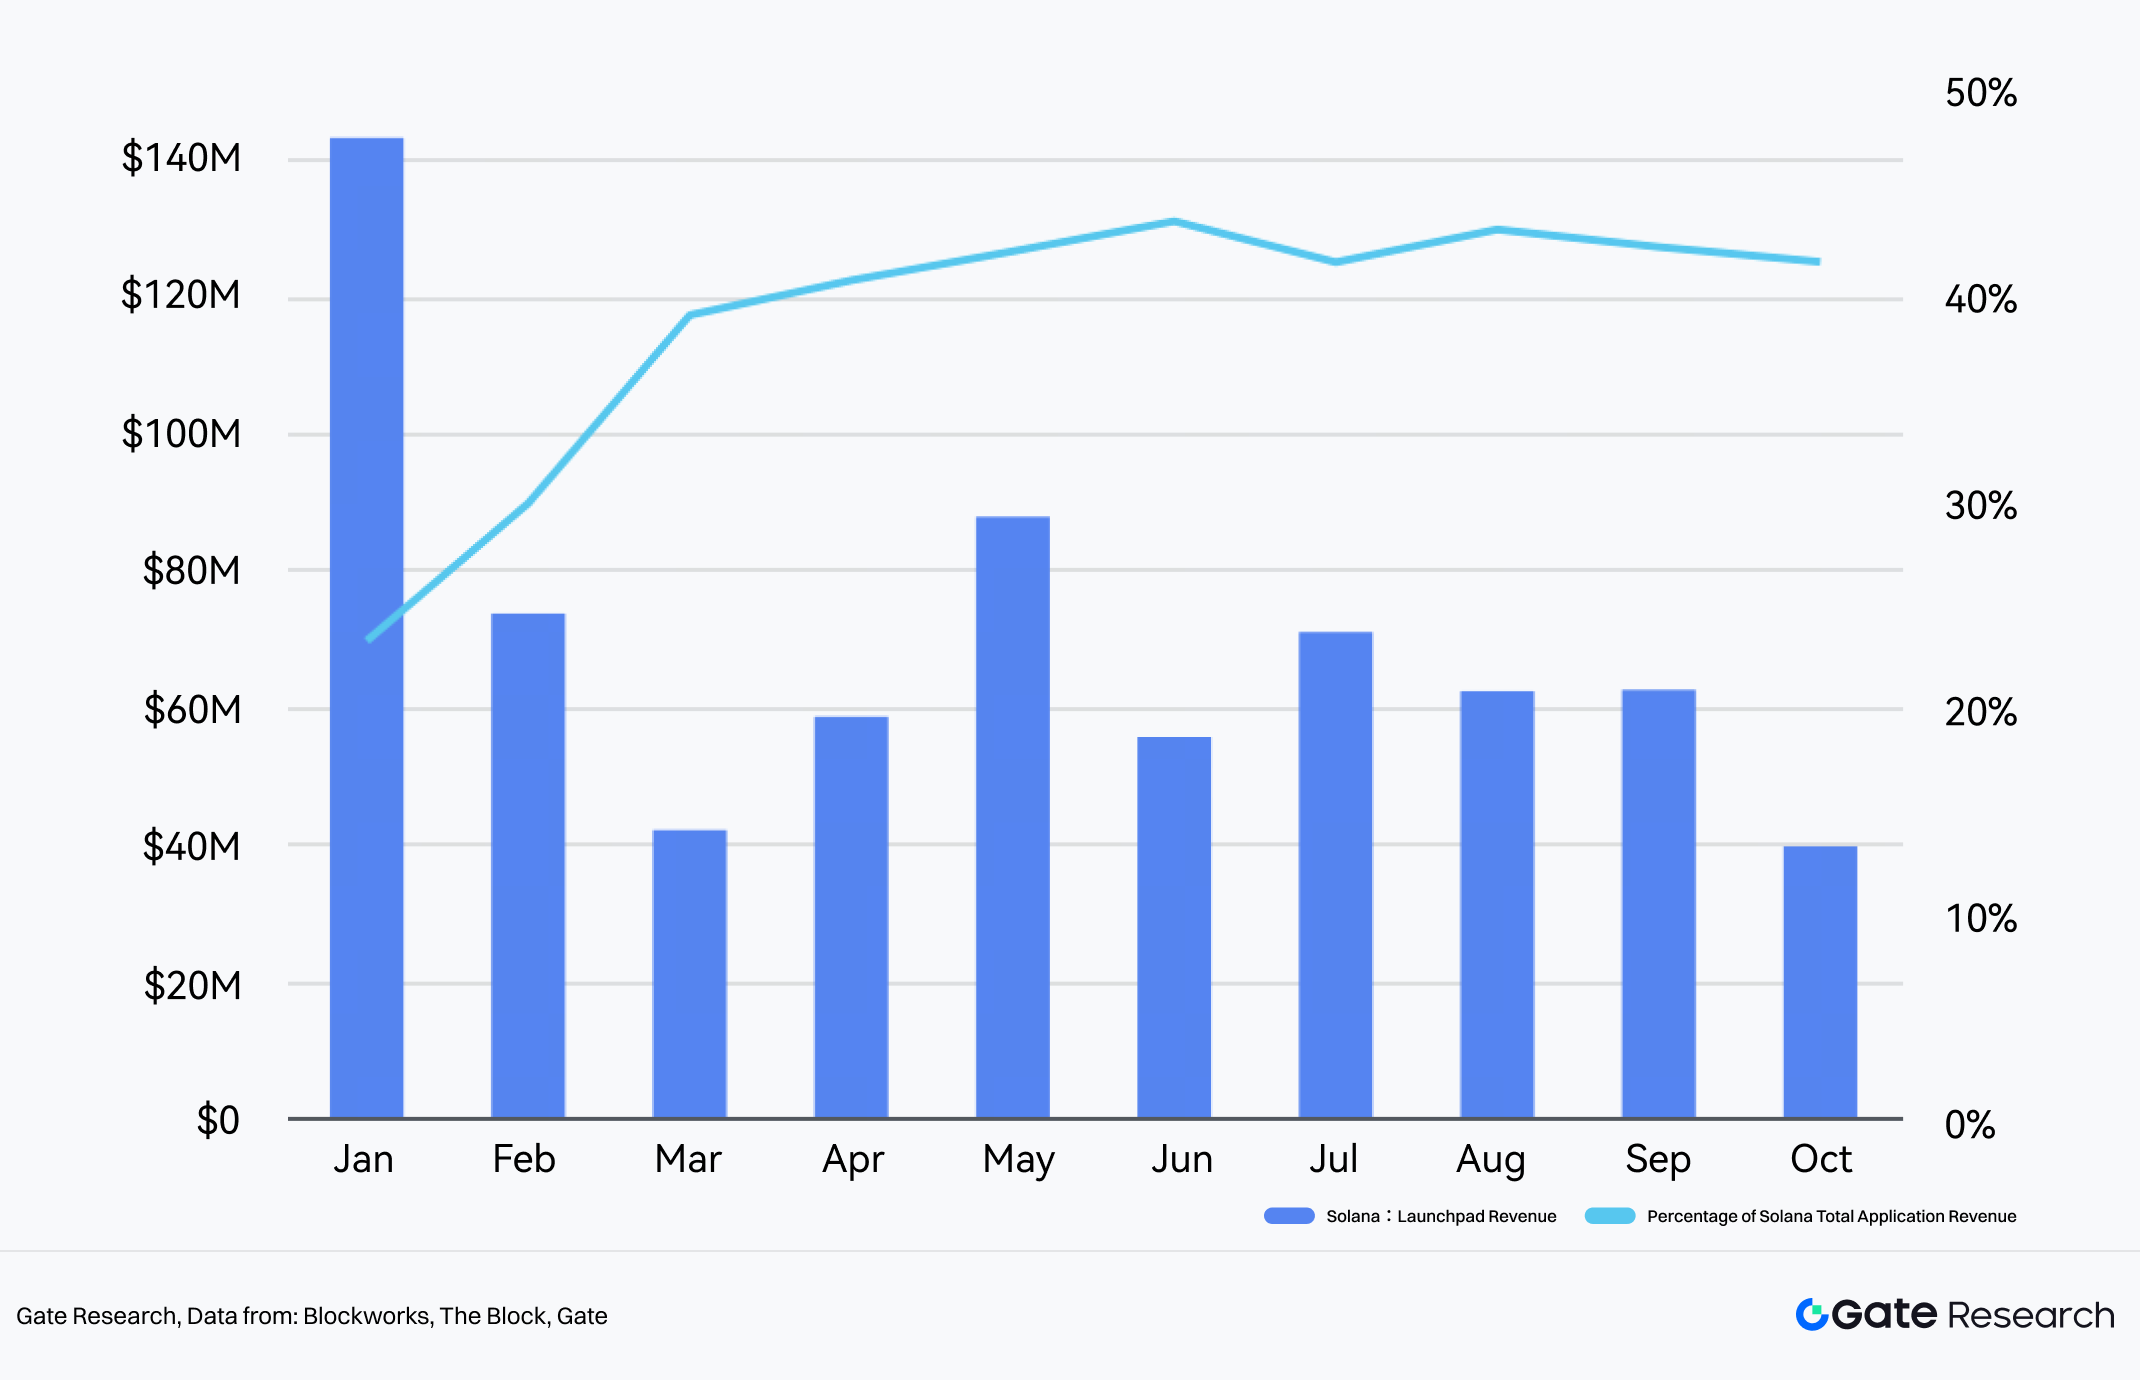
Chart 34: Solana Launchpad Revenue
Date From:Blockworks,The Block,Gate
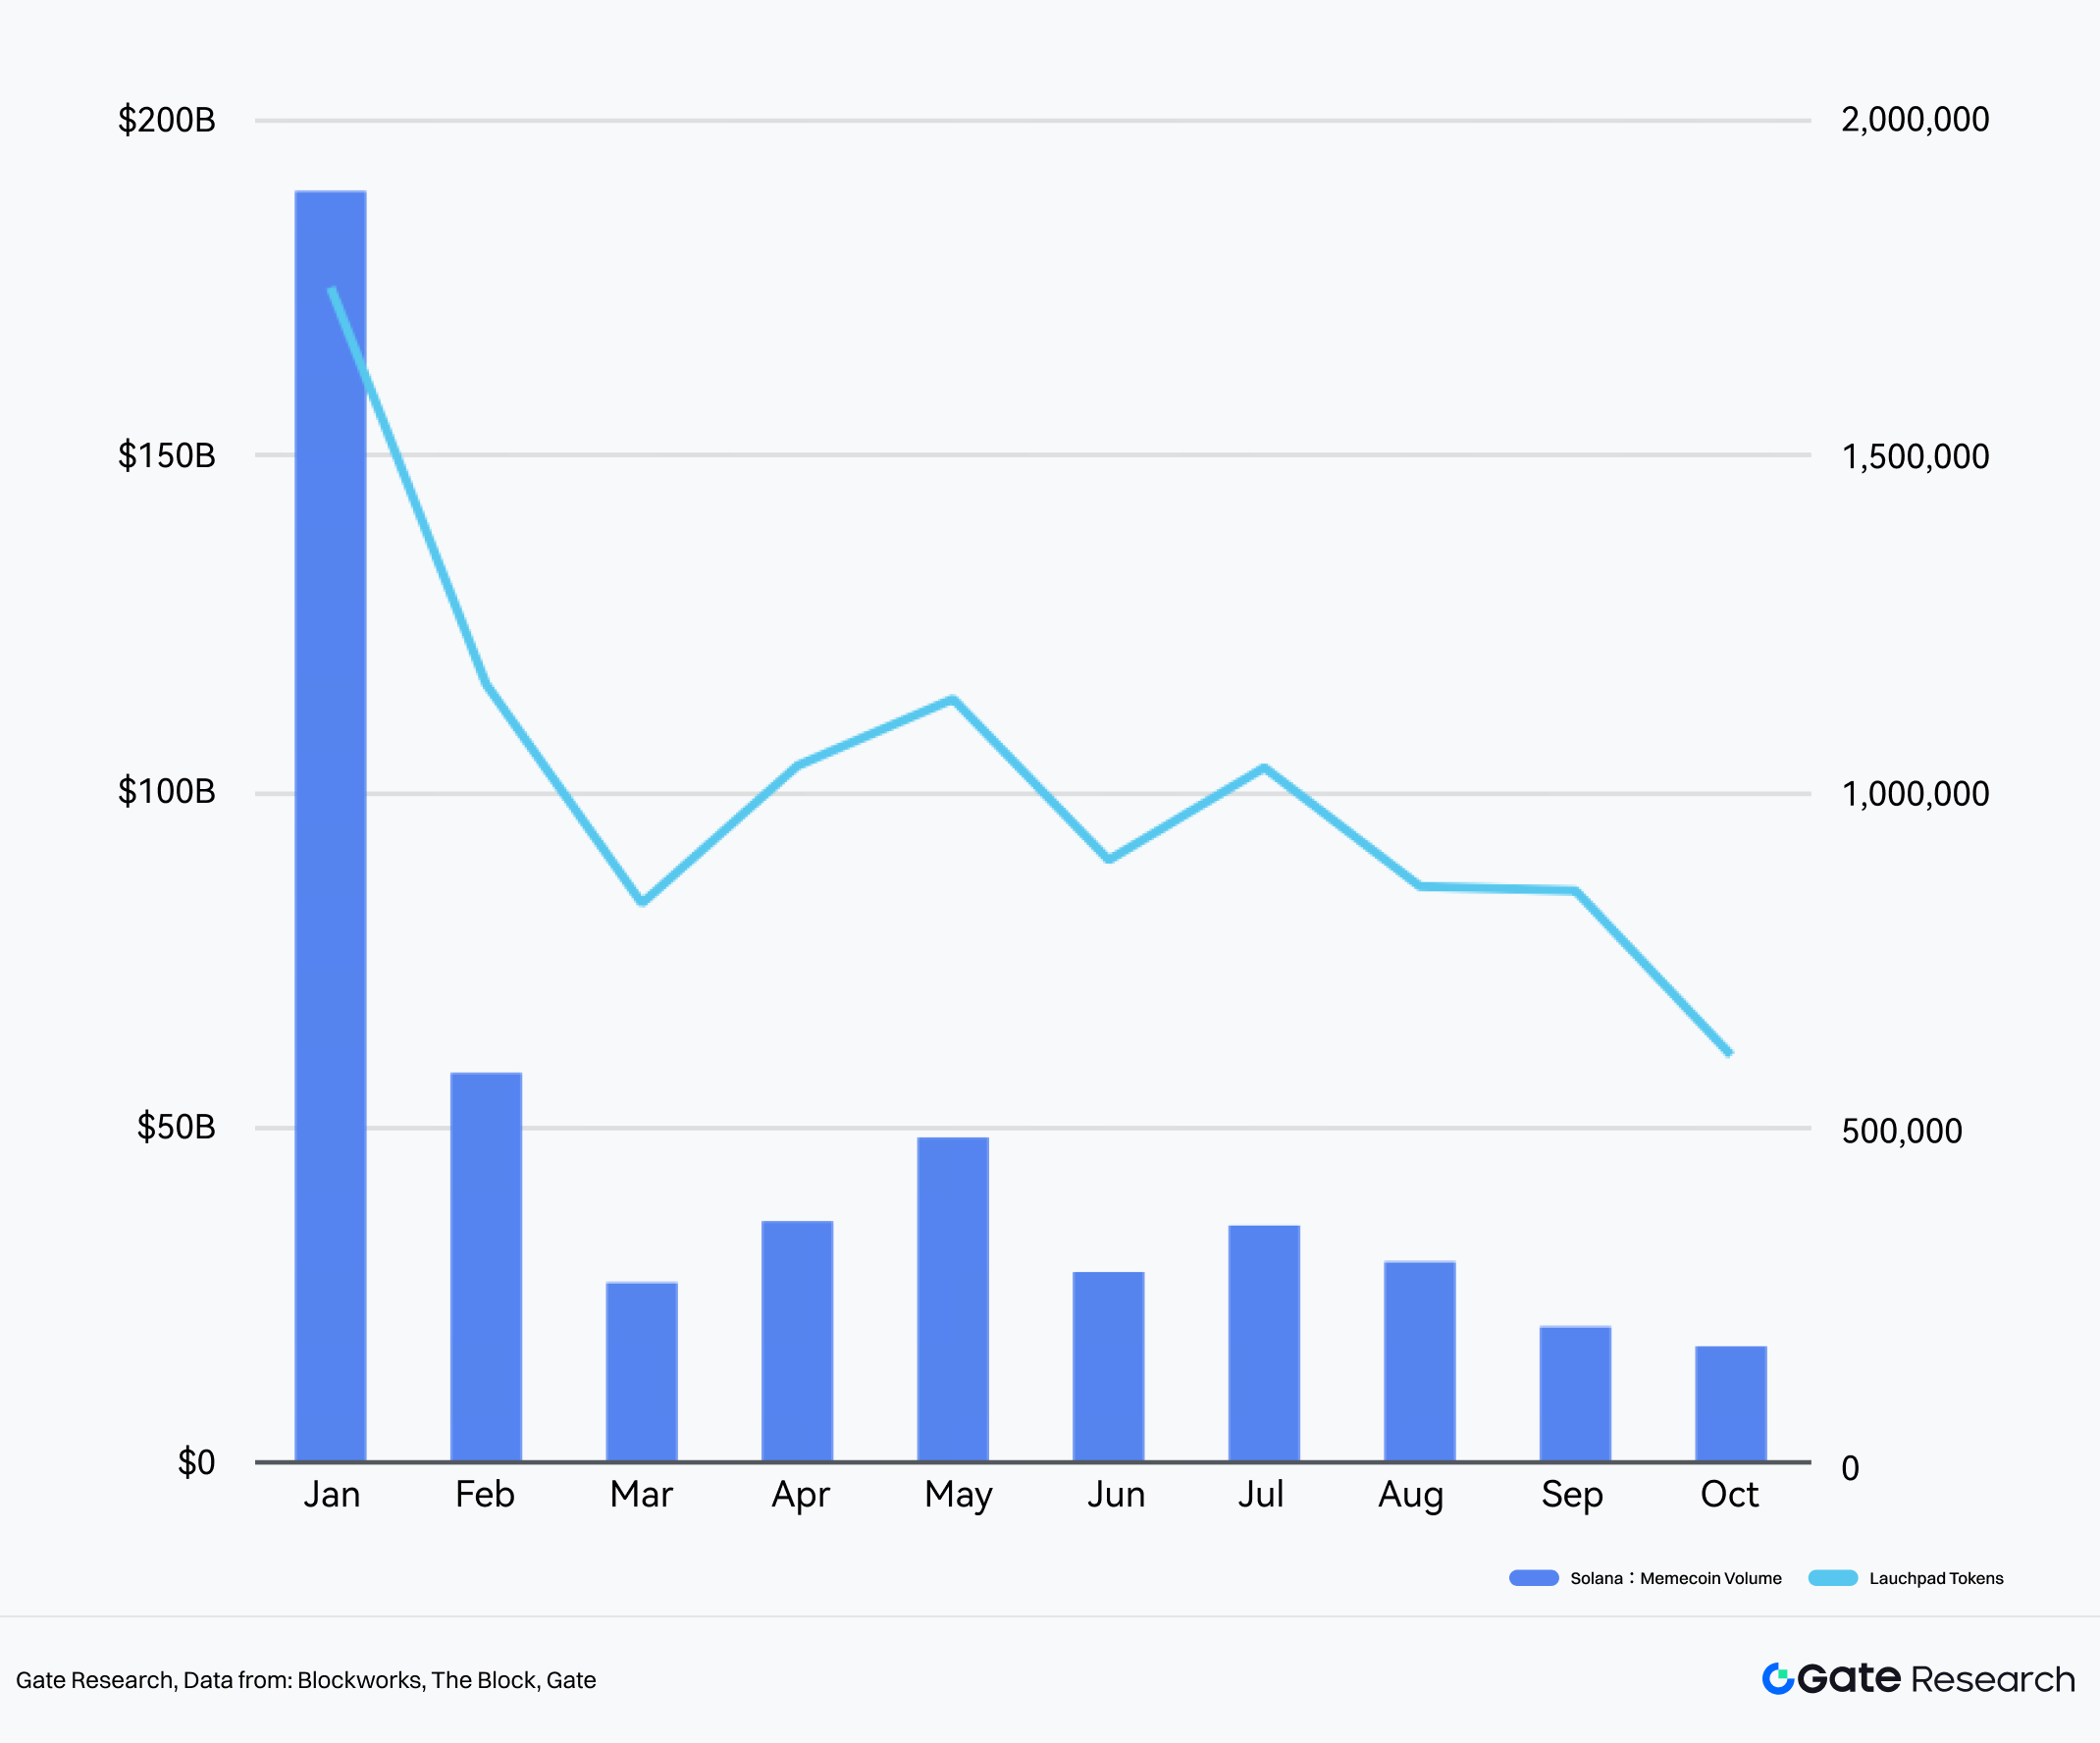
Chart 35: Solana DEX Memecoins Volume and Lauchpad Tokens
Date From:Blockworks, The Block, Gate
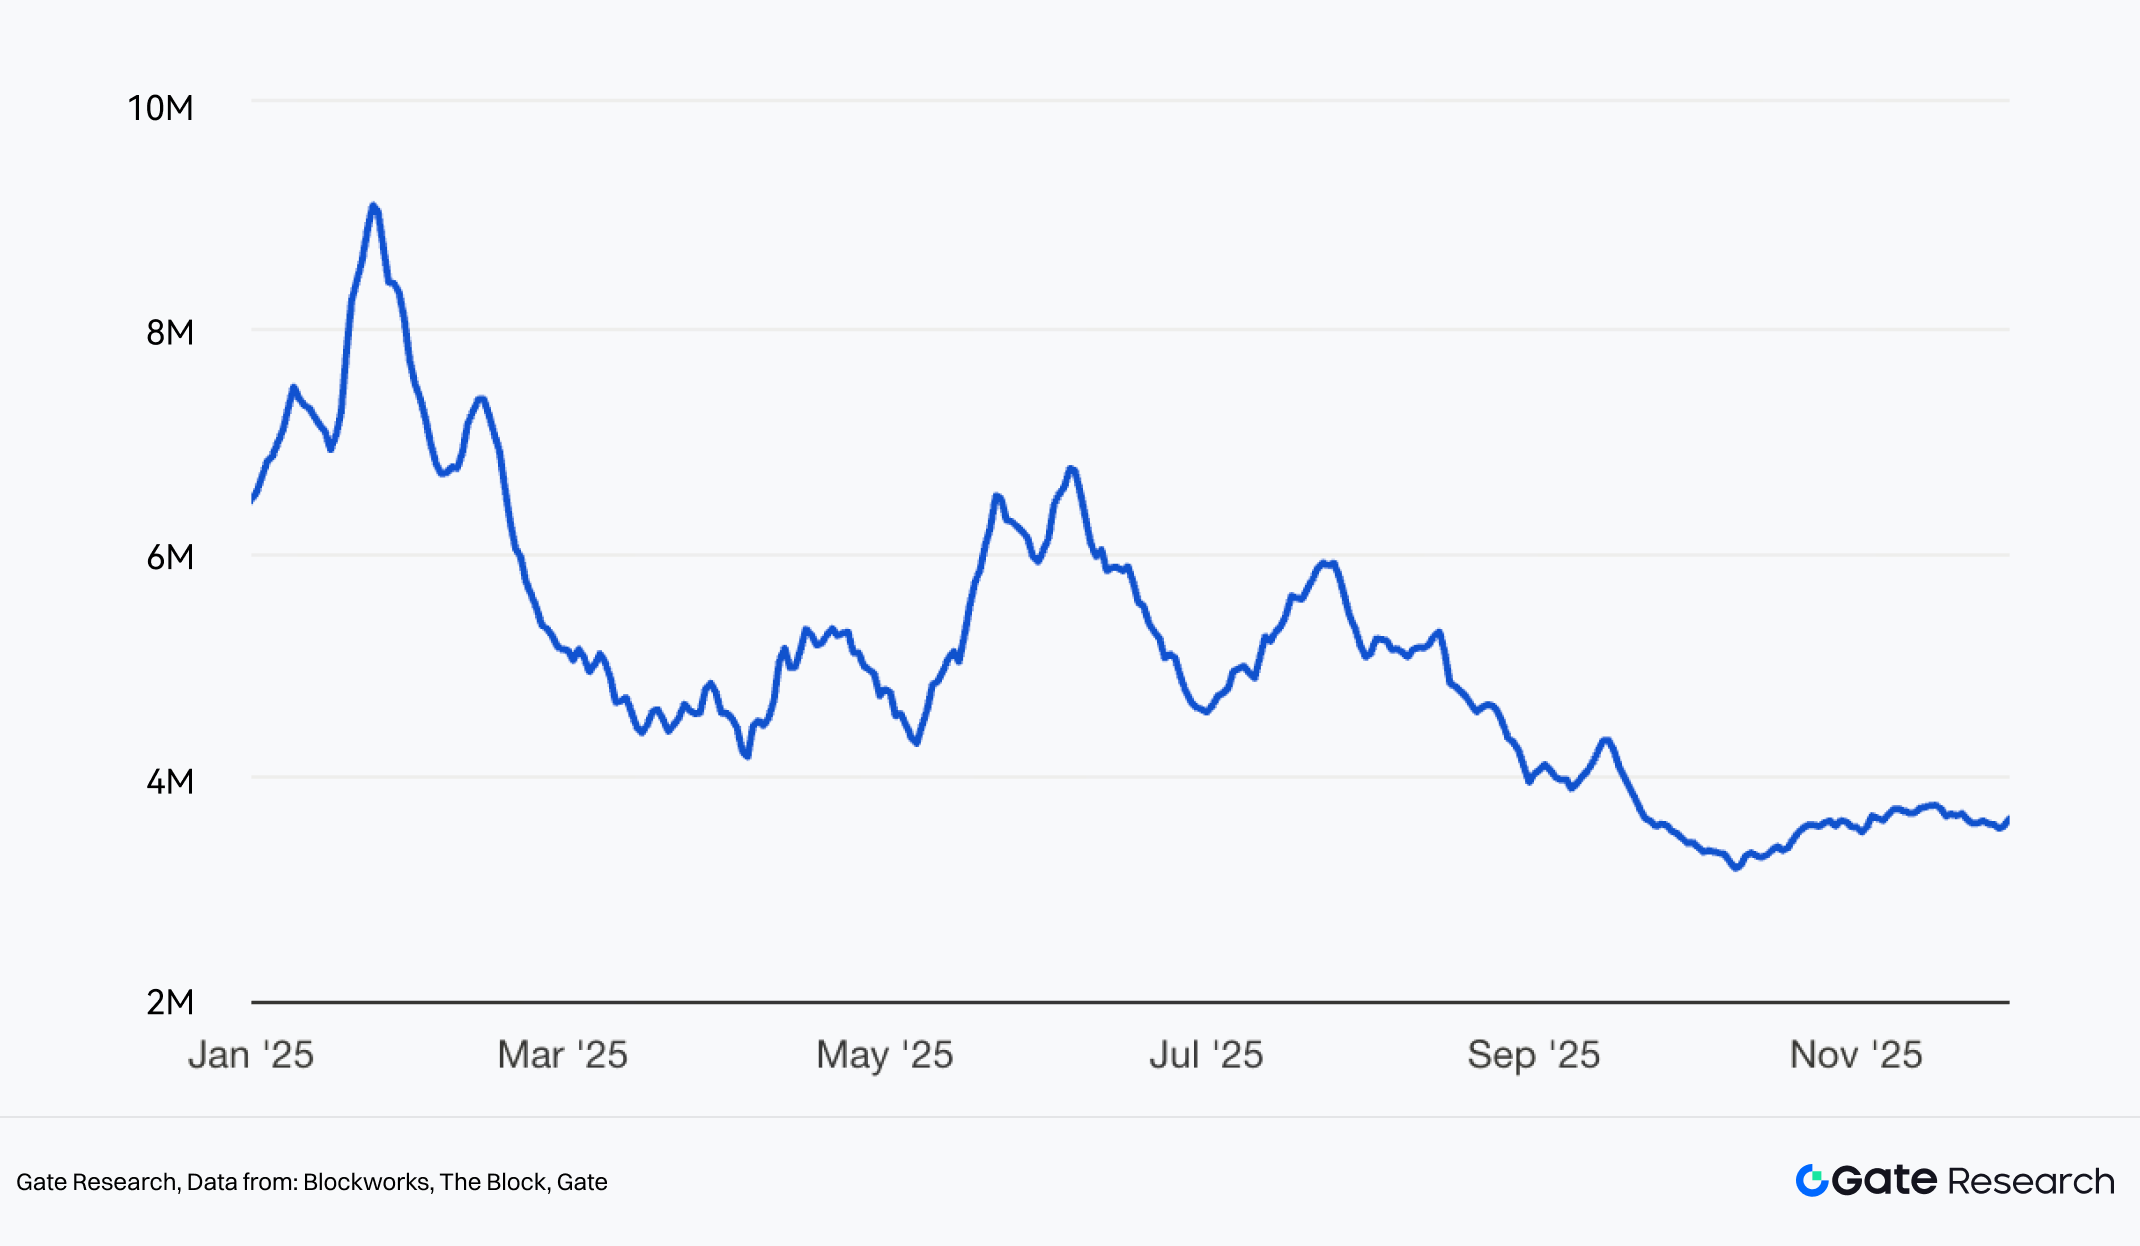
Chart 36: Number of Active Addresses on the Solana Network (Daily, 7DMA)
Data Source:Blockworks, The Block, Gate
2.2 Binance Alpha 2.0 Reshaping Primary and Secondary Market Landscape
In March 2025, Binance Alpha 2.0 went live, breaking the liquidity barrier between on-chain and CEX. Its subsequent launch of trading points + exclusive airdrop/TGE mechanisms created an ecosystem loop where users, projects, and the exchange all win, drastically changing the landscape of primary and secondary markets.
Secondary market liquidity is further concentrating on Binance Alpha.
- Among TGE projects in 2025 with market cap >$20M, 67.29% chose to airdrop/list on Binance Alpha (rising to 74.77% if including direct Binance listings).
- Spot trading volume of projects listed on Binance Alpha accounts for an average of 42.13% of total network spot volume, making it one of the core trading venues for new tokens.
Listing pace on Binance Alpha accelerated, intensifying market cap competition.
- As of Nov 11, a cumulative 265 projects were airdropped/listed, with quarterly data showing a clear acceleration: Q2: 73 → Q3: 127→ Q4 (first half only): 61.
- Nearly half of projects listed on Binance Alpha subsequently listed futures contracts, while only 19.23% listed spot.
- Intensified Market Competition: The average 1-day gain for tokens listed on Binance Alpha was negative for all, with declines widening quarter by quarter; the 30-day average gain improved from -51.74% in Q1 to -36.91% in Q4, with the probability of rising hovering consistently around 30%.
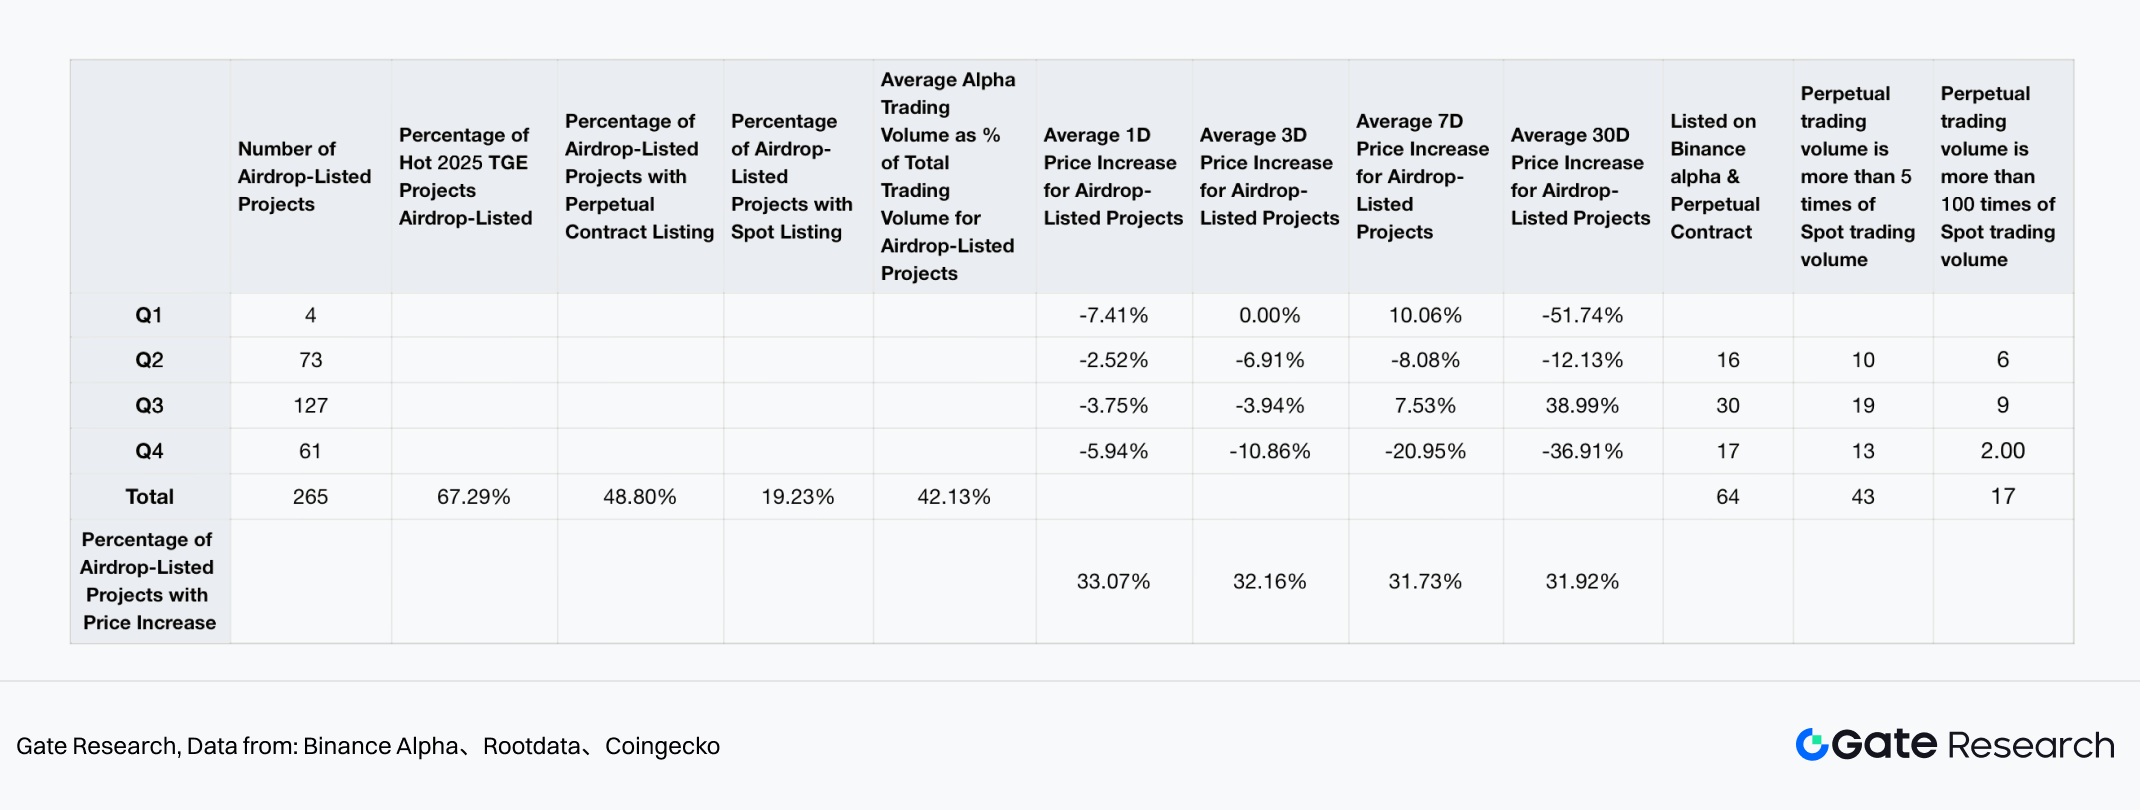
Chart 37: Binance Alpha list Project Performance
Data Source:Binance Alpha、Rootdata、Coingecko Binance alpha空投上线项目统计
Futures trading clearly dominates the Alpha market structure (for projects listed on both Alpha + Futures).
- For projects listed on both (64 projects), futures volume averaged 179 times that of Alpha, far higher than traditionally listed projects.
- 43 projects had futures volume > 5x Alpha; 17 projects had futures volume > 100x Alpha.
(Note: Statistics as of Nov 11, covering only projects listed on both Binance Alpha and Futures. Projects with extremely high spot volume due to users farming Binance Alpha points were excluded.)
2.3 Rise of On-Chain Stock Trading: Traditional Finance and Crypto Market Enter Deep Integration Phase
In May, xStock and Ondo Global Markets successively launched on-chain tokenized stock products, initially covering 60+ Nasdaq core constituents and S&P leaders, achieving 1:1 anchoring to real shares, 24/5 instant settlement, and cross-chain transferability. Mainstream exchanges like Bybit, Kraken, and Gate quickly provided support, listing xStock spot and futures first. Binance Wallet, Bitget Wallet, and others subsequently launched “One-click Buy On-chain Stocks” functions.
The market rapidly presented structural changes driven by real capital:
RWA Total Value Locked (TVL) Explosion: In May alone, RWA TVL grew 11.64% month-on-month; as of Dec 1, RWA TVL was $16.32B, up over 60% from early May. RWA’s share of total DeFi TVL rose from 10% at the start of the year to around 15%.
TradFi (Traditional Finance) Capital Injection:
- Tokenized stocks sub-sector TVL grew from $383M in May to $660M currently (+72%). Ondo and xStock contributed over 75%, with cumulative volume (CEX + DEX) of $12.2B and $1.3B** respectively, led by Tesla, Circle, NVIDIA, and S&P 500 ETF tokens.
- BlackRock’s Ethereum on-chain USD liquidity fund (BUIDL) saw its TVL soar from $600M in early 2025 to a peak of $2.9B**. Currently, exchanges/DeFi protocols like Binance and Aave support BUIDL as collateral for lending.
Crypto Native Capital Reallocation:
- The current ETH staking total reached 35 million (28% of total supply), trending up since the start of the year, with TVL over $45B (+150%). Capital flowed out of high-Beta altcoins towards LSTs (Liquid Staking Tokens) like stETH to capture staking yields.
- Yield pools like Lido, Aave, and Ethena saw TVL growth of over 20% this year, with Aave growing over 100% at its peak.
Conclusion: Capital sources show two distinct streams: On one hand, TradFi capital injects into on-chain stocks via platforms like Ondo Finance seeking 24/7 trading and instant settlement; on the other hand, crypto native capital is shifting from high-Beta speculative assets to “yield-bearing asset pools” with real cash flow and regulatory backstops. This means the crypto market’s asset structure is transforming from being purely “crypto-native narrative driven” to “hybrid asset and real yield driven.”
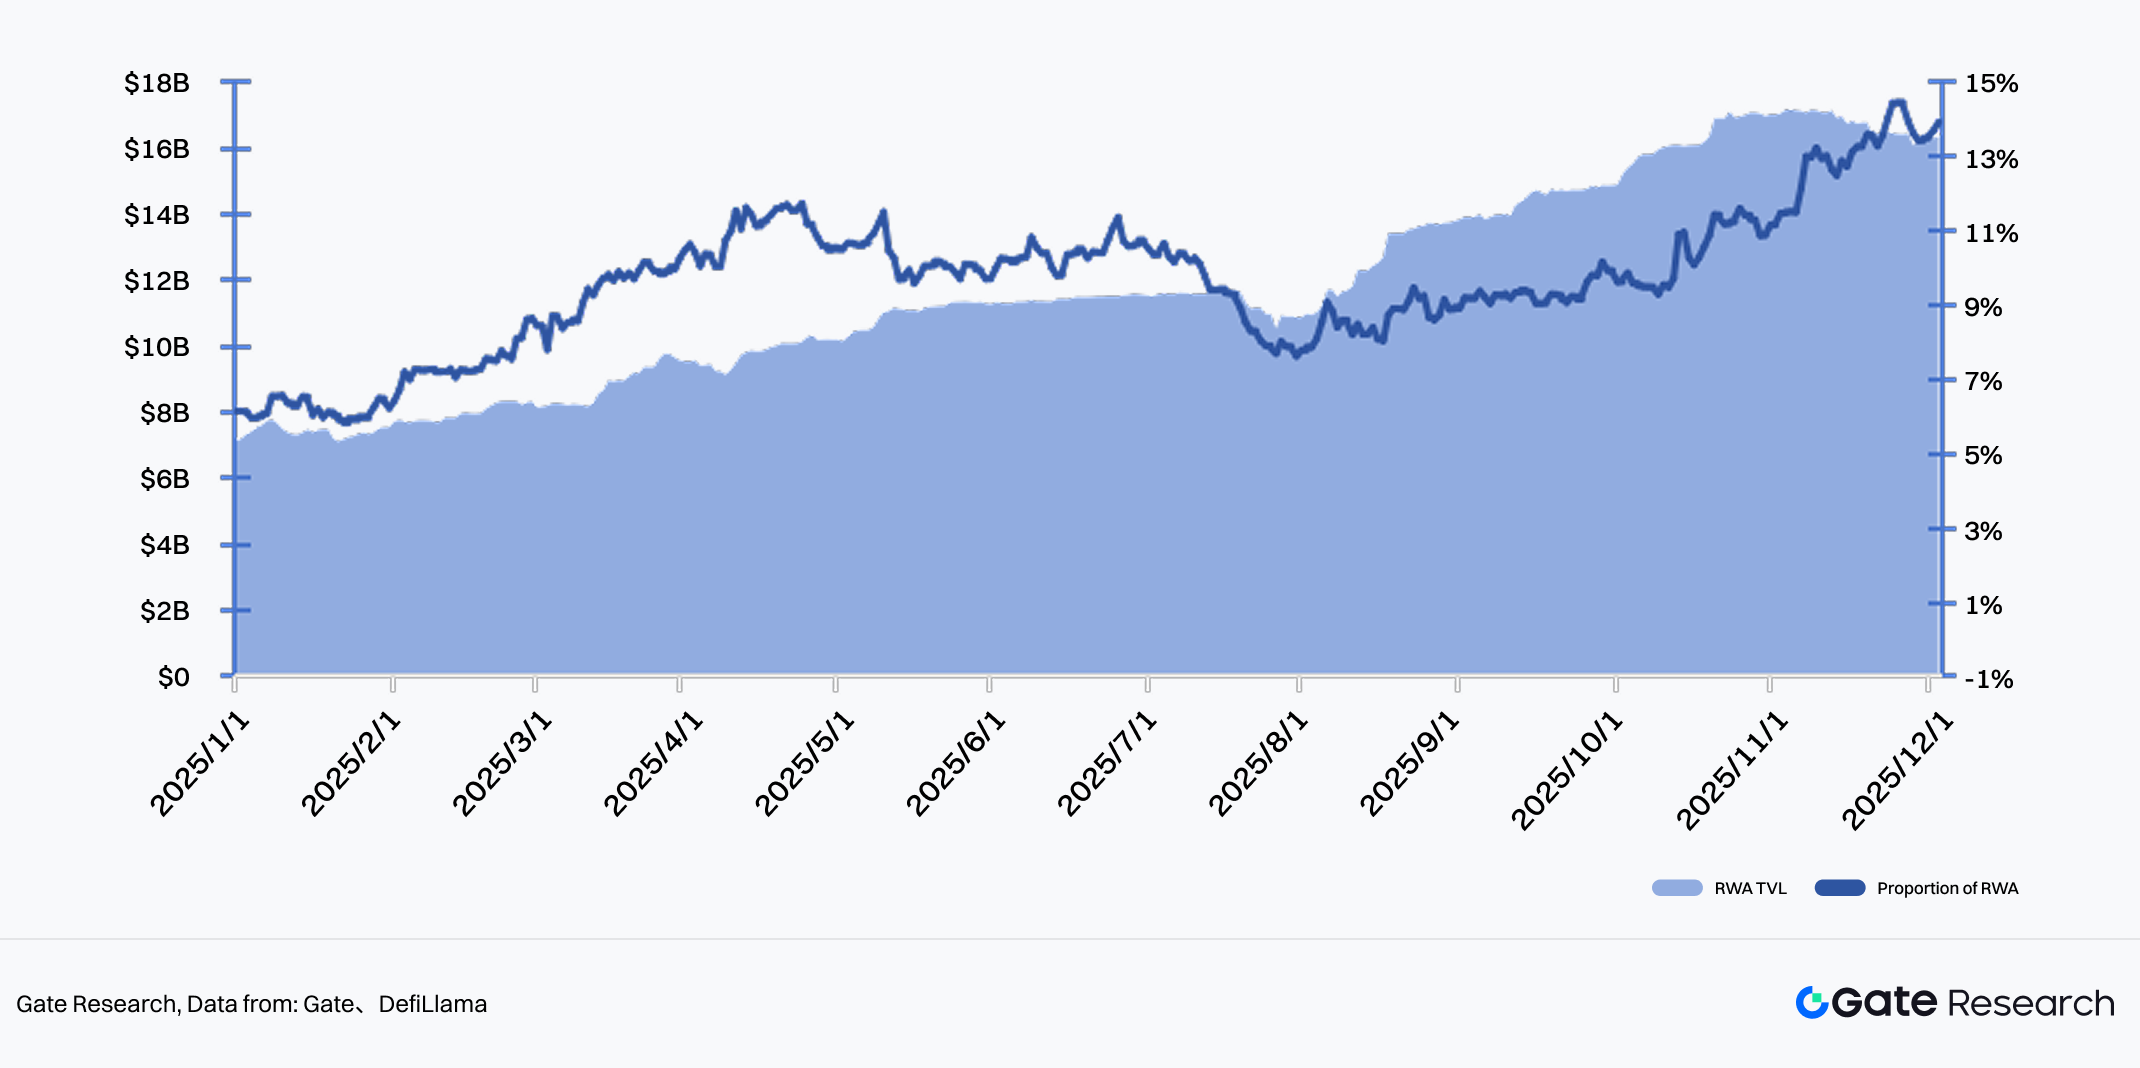
Chart 38: Trend chart of RWA TVL and percentage of DeFi total TVL in 2025
*Data From:DefiLlama, GATE
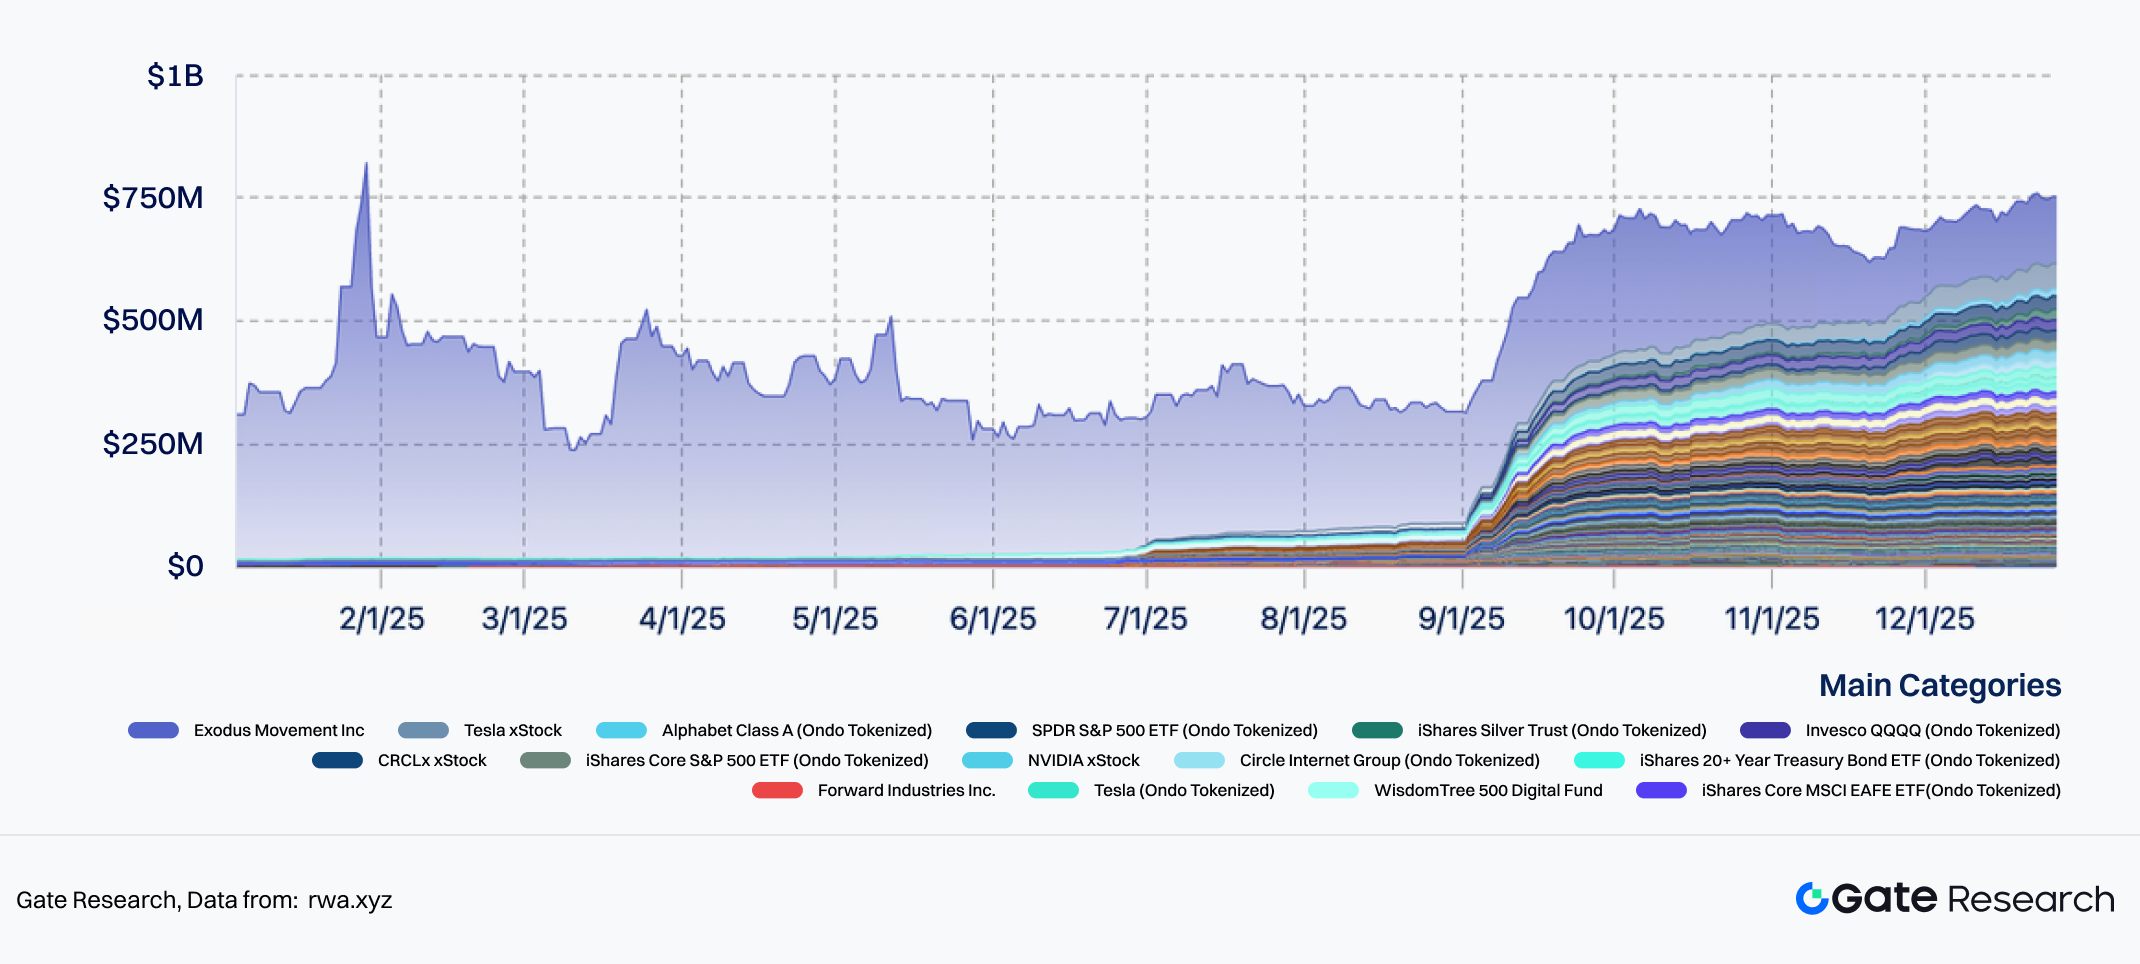
Chart 39: Changes in TVL of the Monetized US Stock Market in 2025
Data From:rwa.xyz
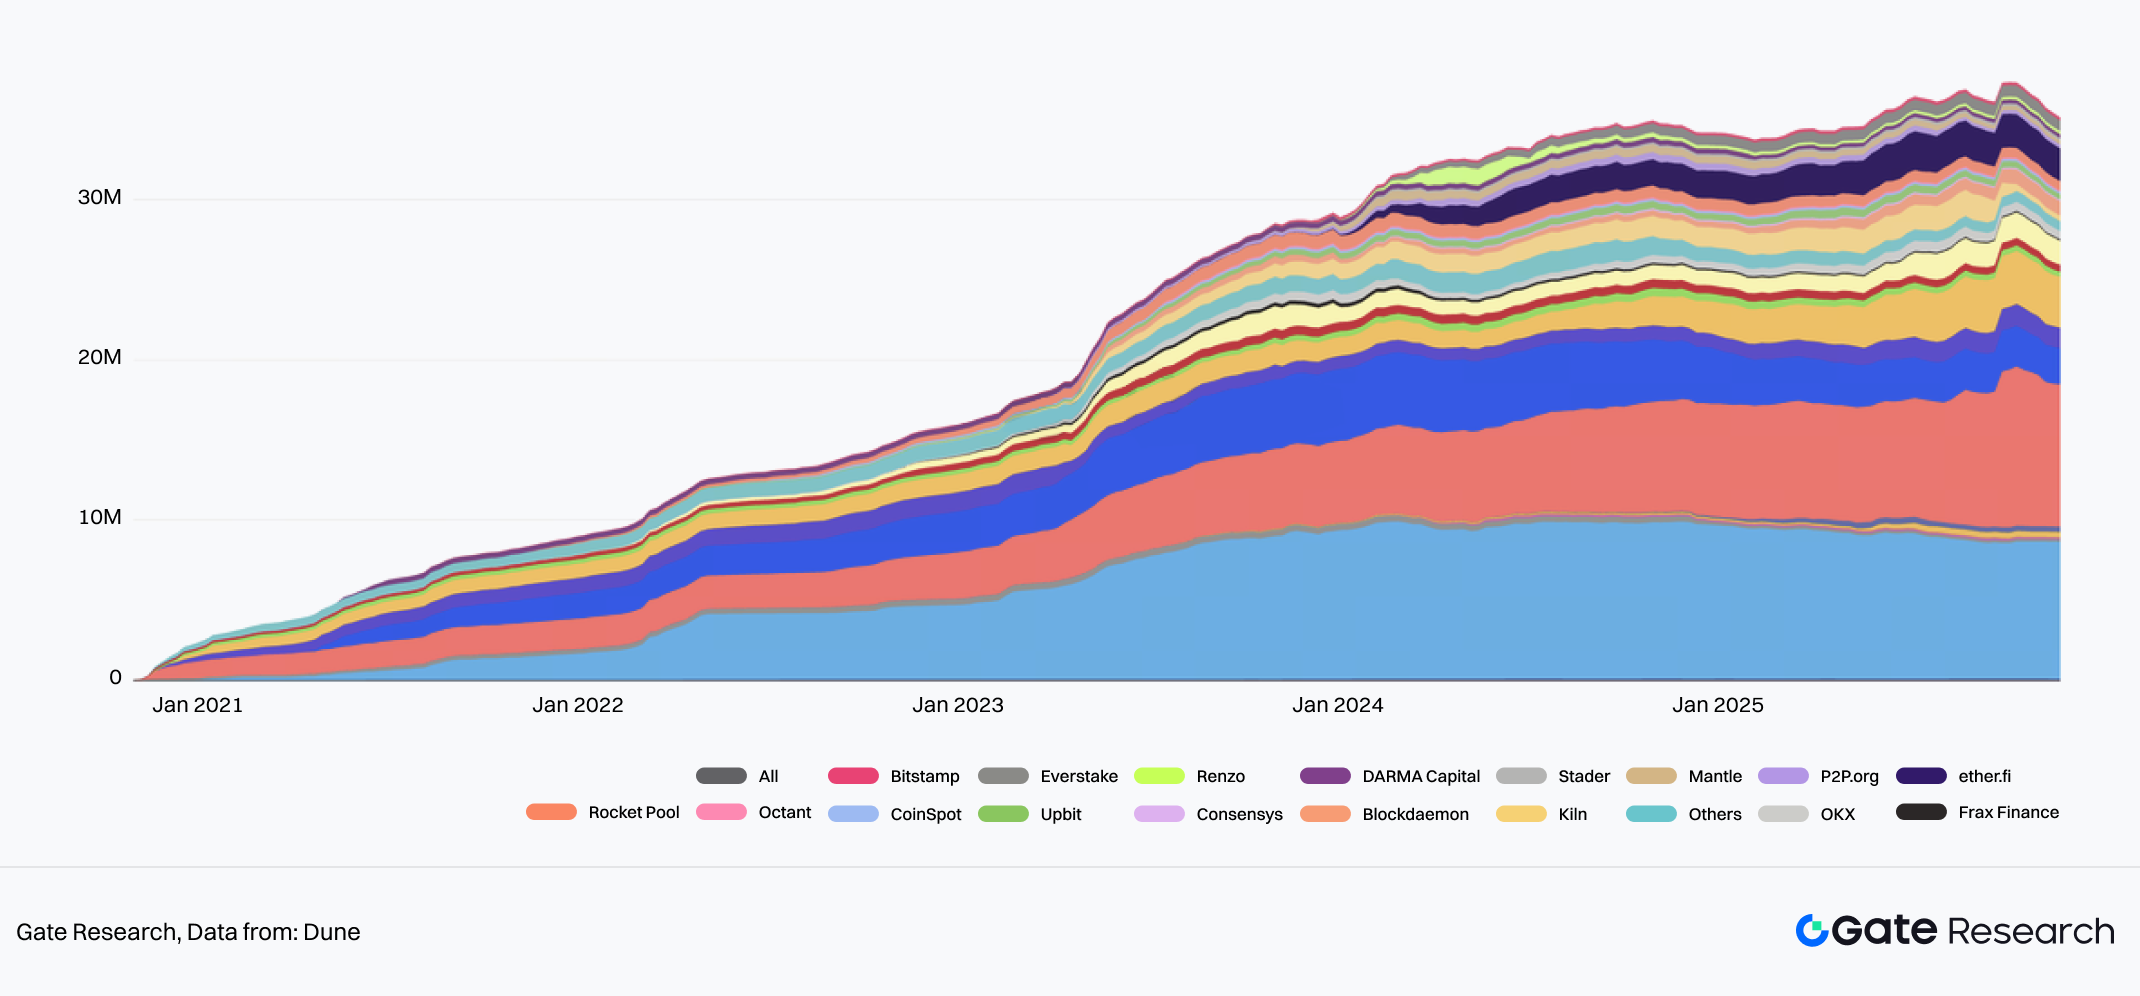
Chart 40: Changes in the total amount of ETH staking
Data Source:Dune
2.4 Hyperliquid Rise: On-Chain Perps Thoroughly Ignited
In the second half of the year, Hyperliquid, relying on a fully on-chain matching architecture, non-custodial and KYC-free user experience, and low slippage/high performance matching comparable to CEXs, ascended to become one of the top five global derivatives trading platforms. Against the backdrop of frequent CEX blowups and lack of audits, the “Self-Custody + No Centralized Counterparty Risk” attribute made it a primary destination for high-leverage traders migrating on-chain.
$HYPE Strong Resilience:
- Hyperliquid’s native token $HYPE rose from $40 in early August to an All-Time High (ATH) of $58.53 on Sep 19, a gain of +46.3%.
- It retraced about 36% after the 10.11 flash crash but repaired rapidly, currently maintaining a high of $30+, demonstrating strong resilience.
Platform TVL Explosion:
- Platform TVL exploded from $2.3B in May to the current $4.35B, nearly doubling.
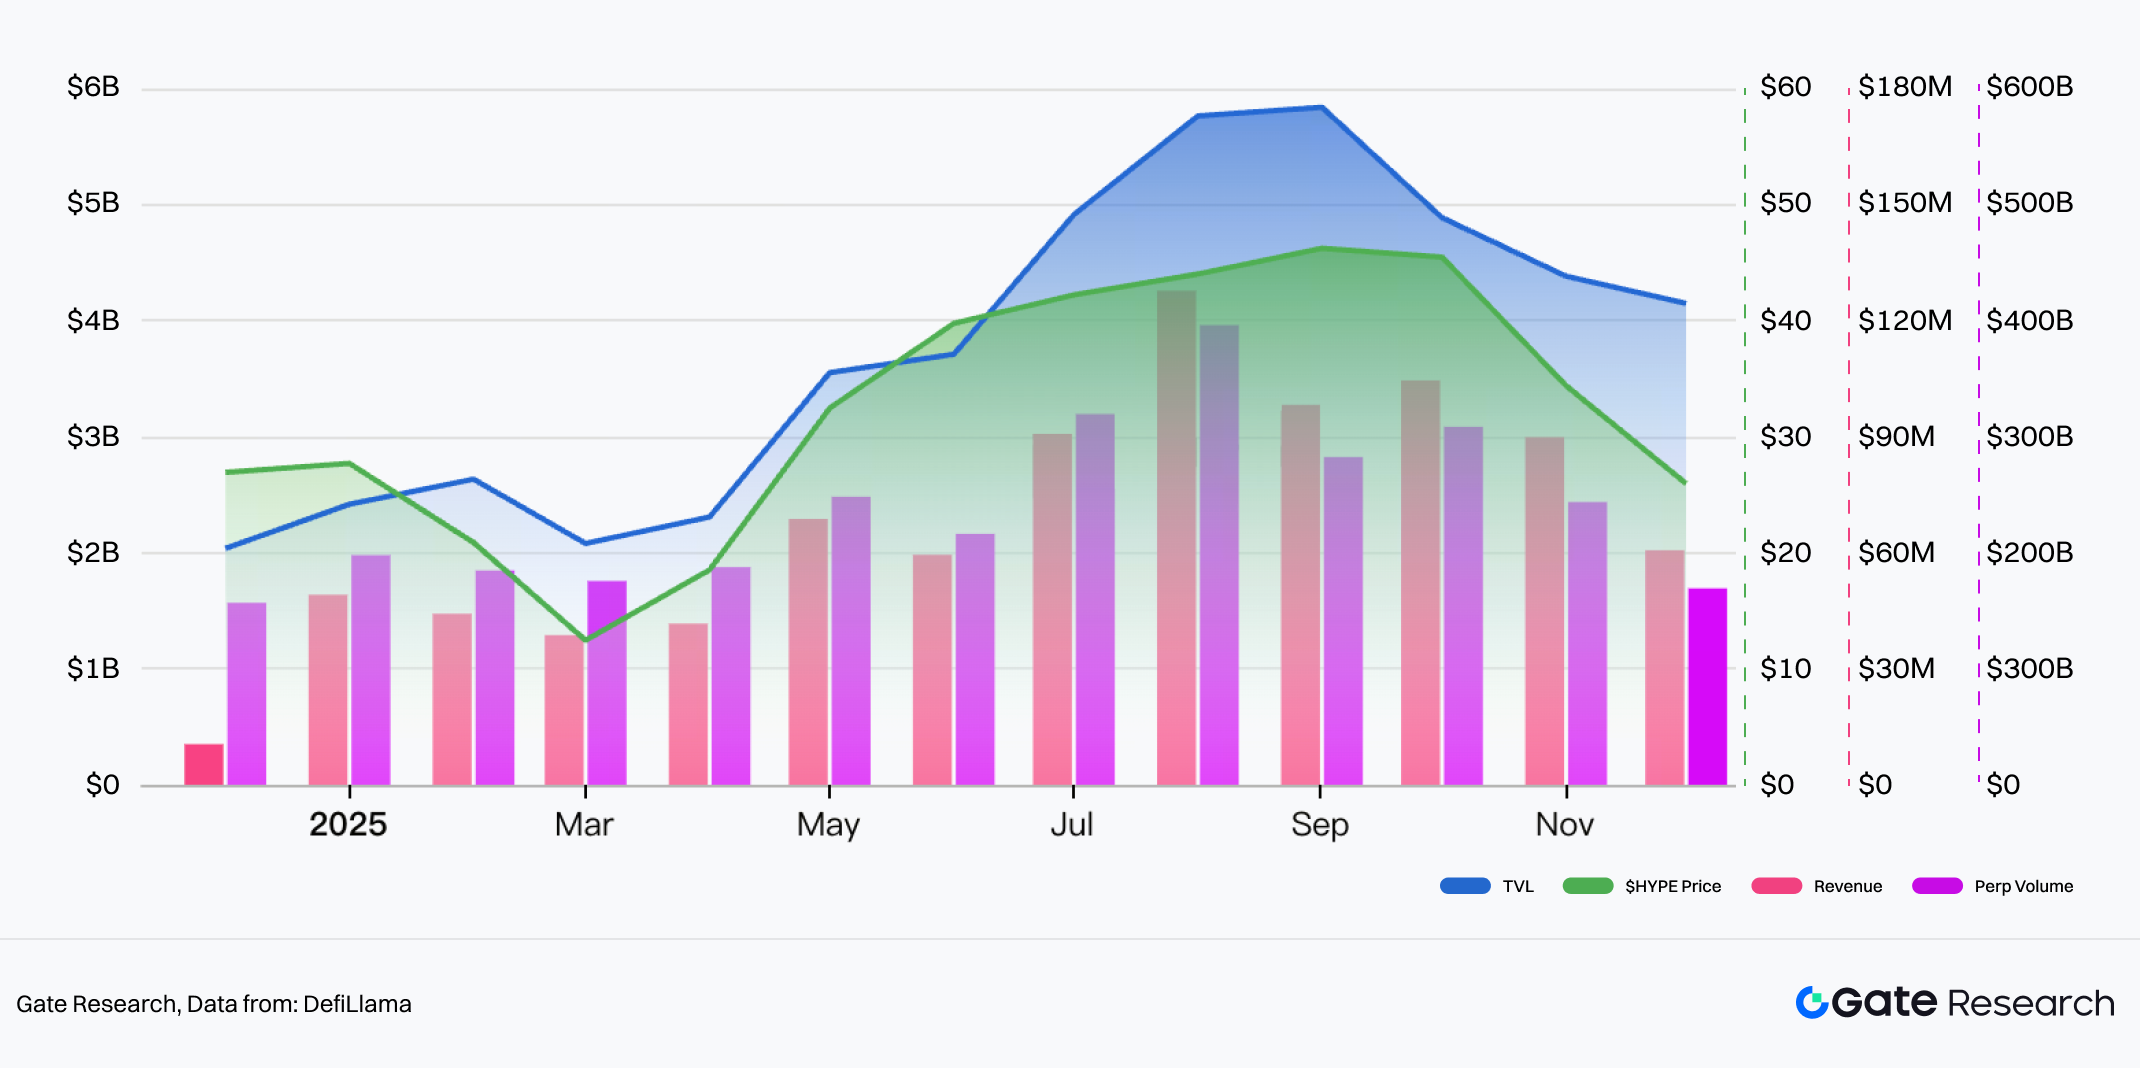
Chart 41: The price trend, platform TVL, revenue, and Perp Vol of Hyperliquid native token $HYPE
Data Source:Defilama
Volume Firmly Leading DEX Derivatives:
- In 2025, Hyperliquid’s single-platform cumulative Perps volume reached $3.40T. Current 30d Perps Vol is $249.6B, accounting for 18.8% of total Perps volume and 64.8% of total DEX volume, firmly occupying the top spot in DEX derivatives.
- The ratio of Hyperliquid futures volume to Binance futures volume rose from 2.52% at the start of the year to 10+%.
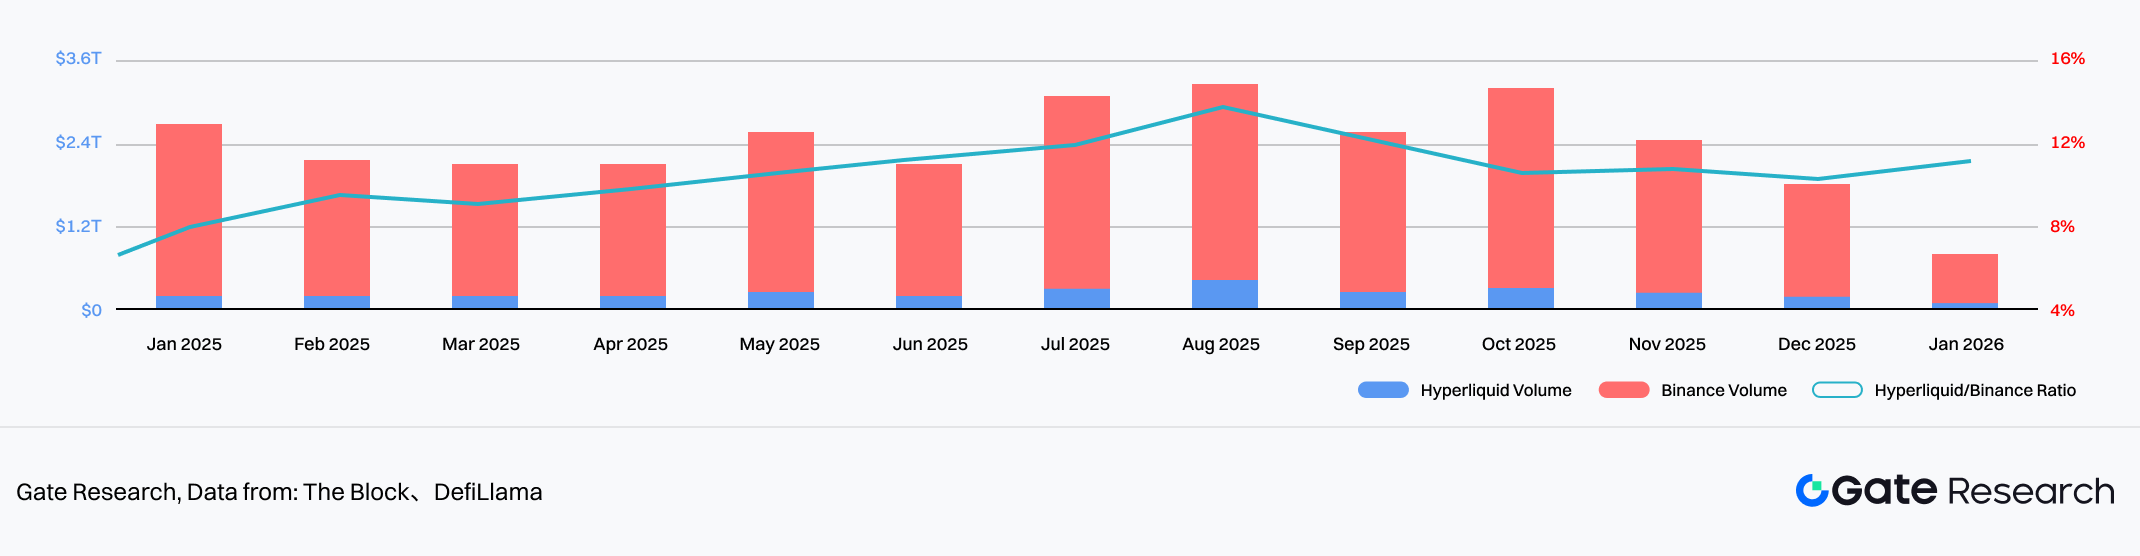
Chart 42: Comparison of trading volume between Hyperliquid and Binance futures
Date from: The block, DefiLlama
On-Chain Perps Devouring CEX Share:
- The ratio of DEX futures volume to the global total futures market showed rapid growth, reaching 14.11% by October, an increase of 9.16% from the beginning of the year.
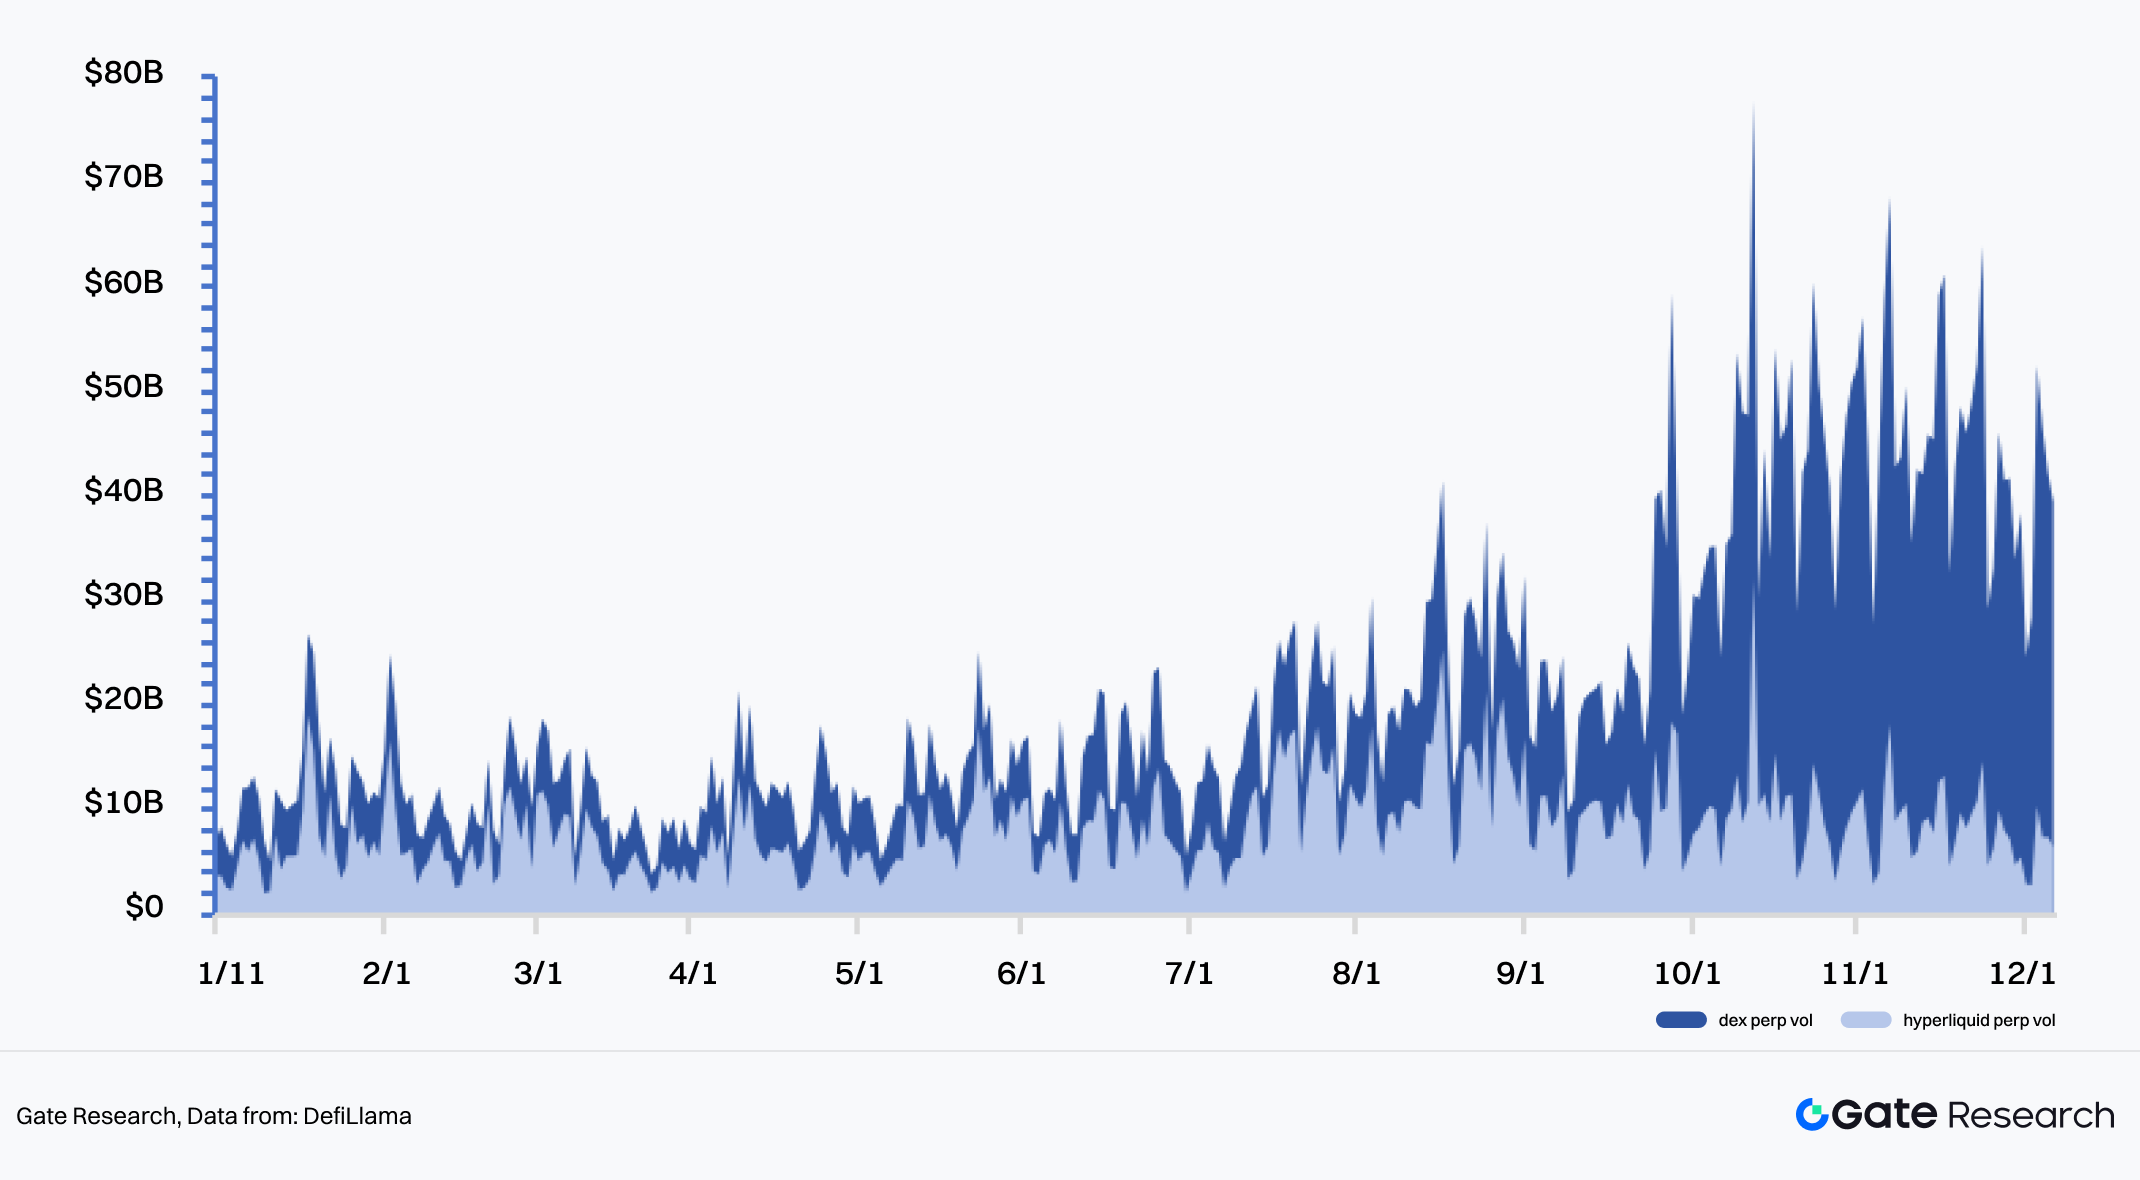
Chart 43: Comparison of perp trading volume between Hyperliquid and DEX (total)
Data From:DefiLlama
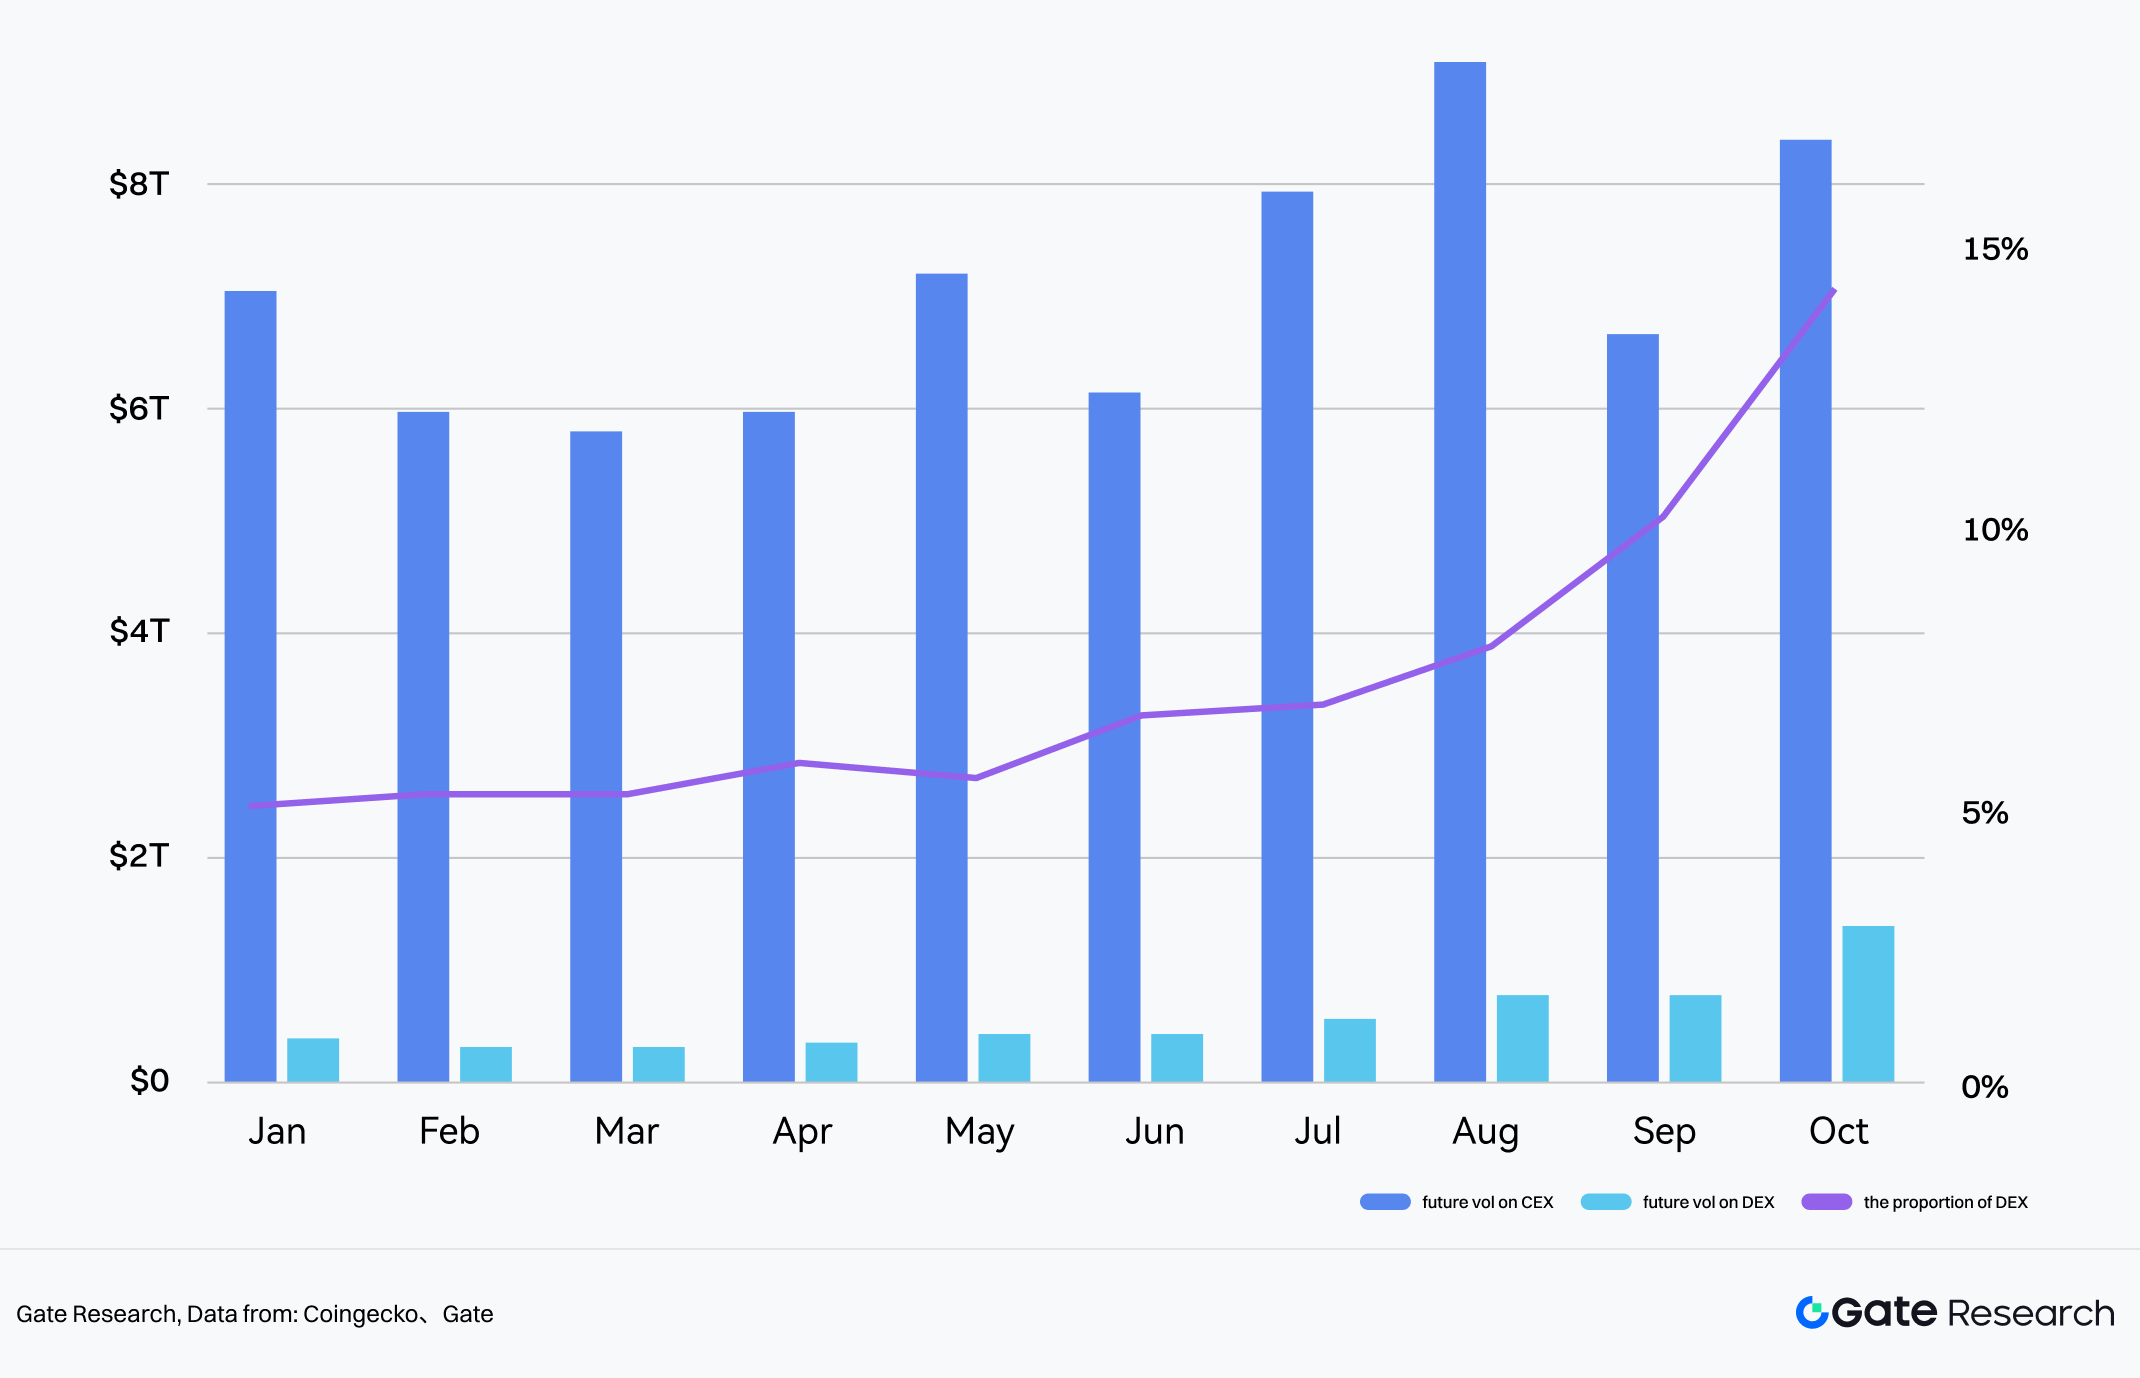
Chart 44: Comparison of monthly future trading volume between CEX and DEX
Data From:Coingecko,Gate
Benefiting from advantages in performance, on-chain execution transparency, and user experience, on-chain Perps markets represented by Hyperliquid achieved explosive growth in 2025 and gradually eroded CEX market share, showing a trend of on-chain perps moving from the fringe to the mainstream.
Overall, user preference for high-performance, transparent execution environments is reshaping the derivatives market landscape. While on-chain Perps are expected to maintain high growth, one must be wary of dual risks from Regulation and Liquidity (the 10.11 flash crash warned of liquidity risks under extreme conditions).
2.5 Micro Liquidity Indicators: Market Hollows Out and OI Contracts After 10.11 Flash Crash
On October 11, Trump’s tariff statement triggered global risk-off panic, crashing the crypto market: BTC plunged 15% in the short term, Binance had an outage, USDE de-pegged, further amplifying chain reactions. Within 24 hours, network-wide liquidations soared to a record $19B.
Market Depth (how much buying/selling volume the current price can withstand without significant movement, directly reflecting real liquidity) declined significantly, exposing the crypto market to risks of violent price fluctuations.
- BTC depth continued to decline with weak rebound: In early October, the average cumulative depth of BTC on major trading platforms (1% from mid-price) was close to $20M. However, this indicator plummeted by nearly one-third on Oct 11 and showed almost no rebound subsequently.
- Altcoins rebounded from panic but have not recovered to previous strength: The 1% depth for altcoins shrank rapidly from nearly $2.5M to around $1M. Although it rebounded to around $1.8M by Nov 11, overall liquidity remains poor.
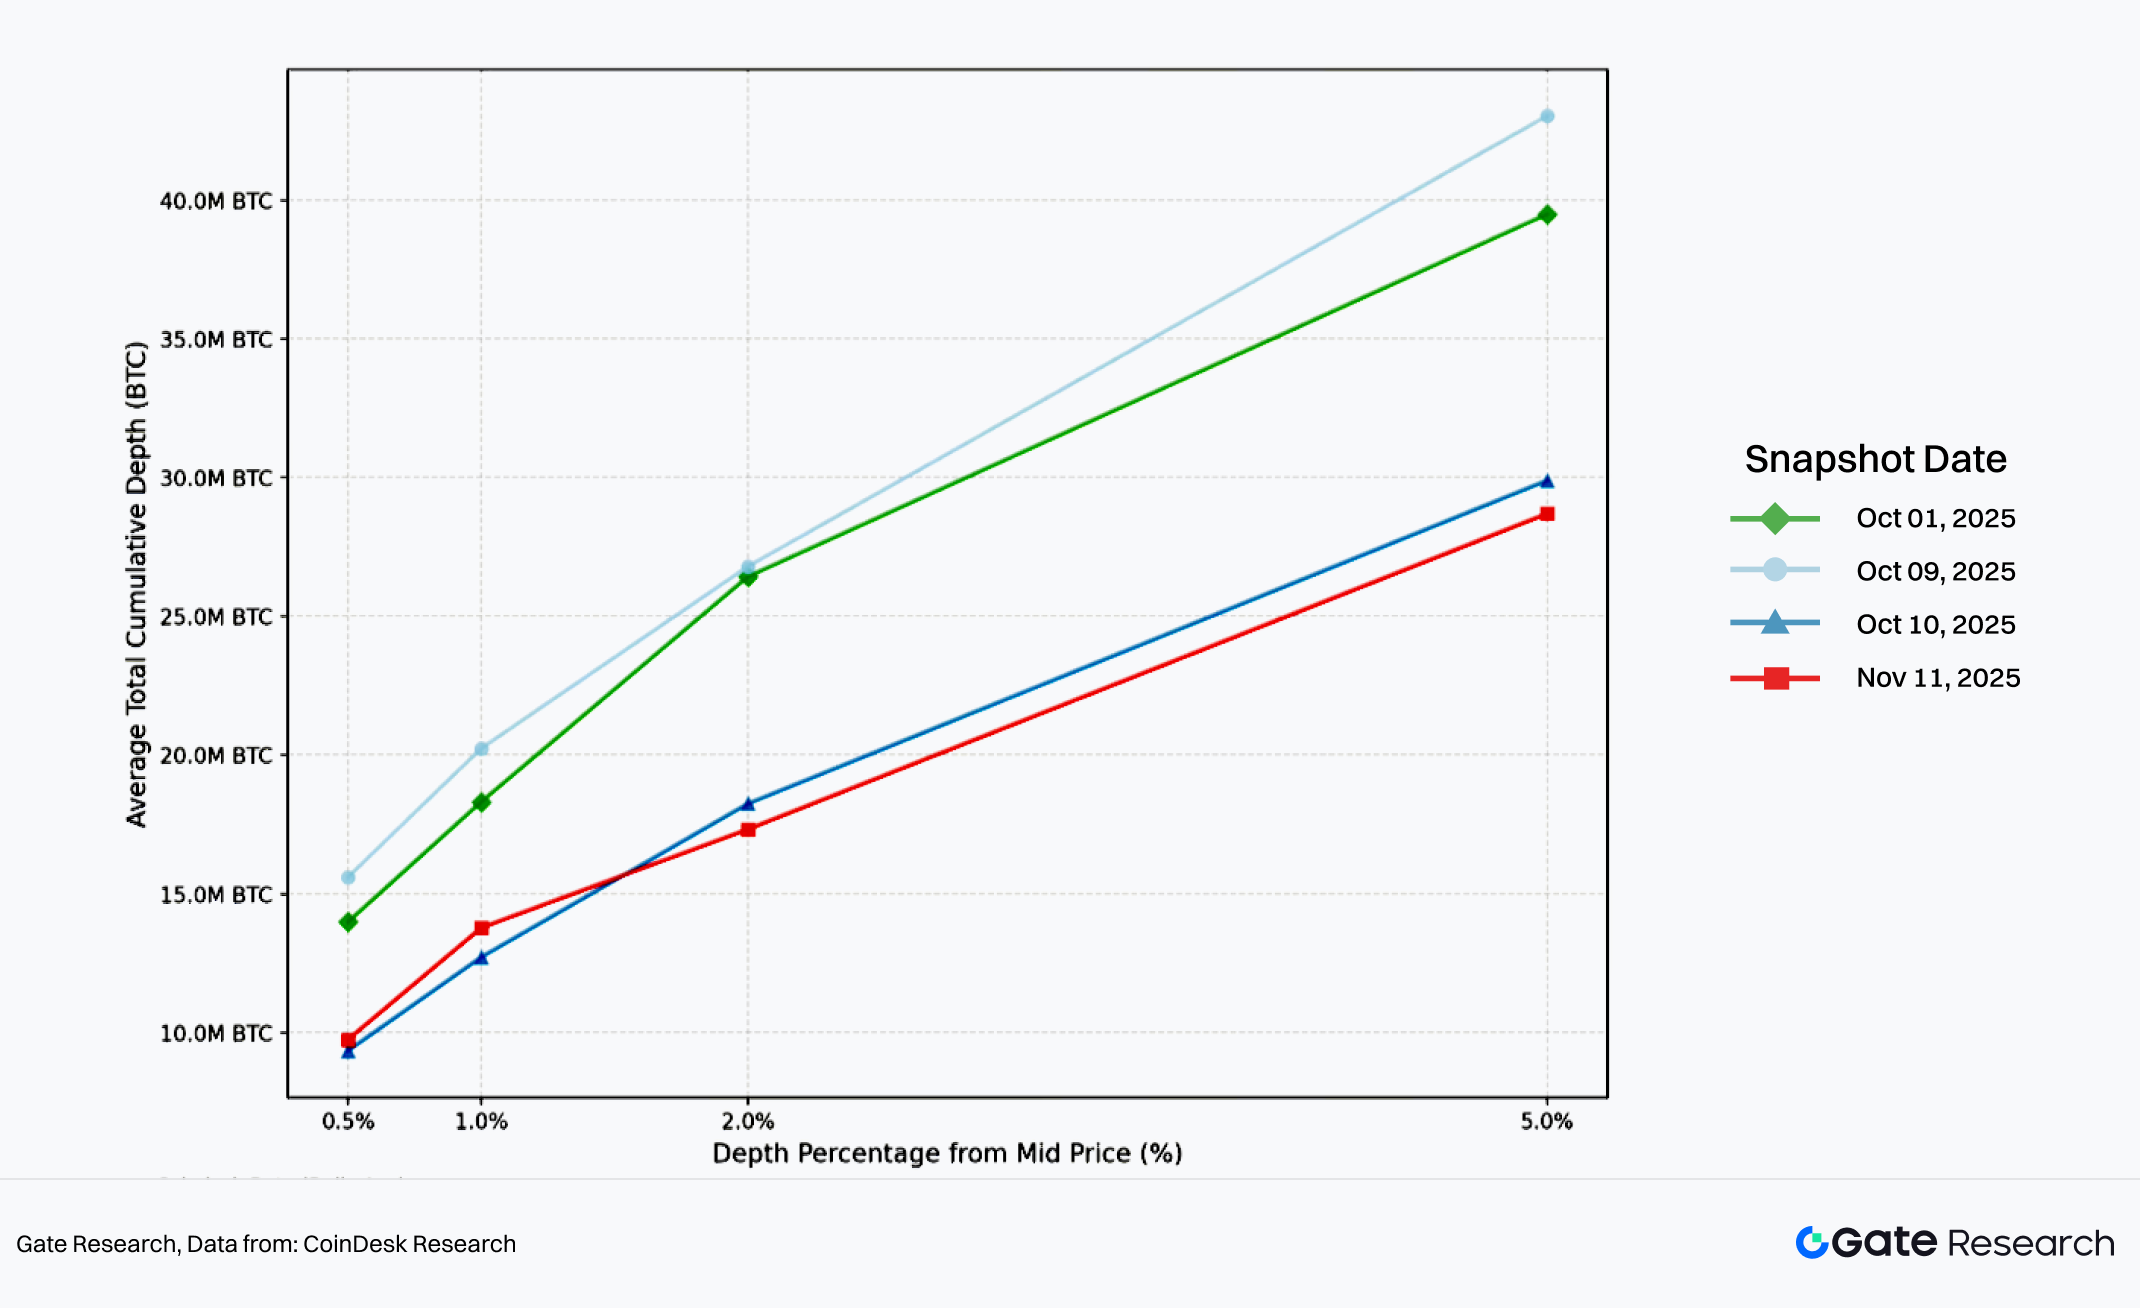
Chat 45: BTC Average Total Liquidity Comparison by Date
Data From:Coindesk Research
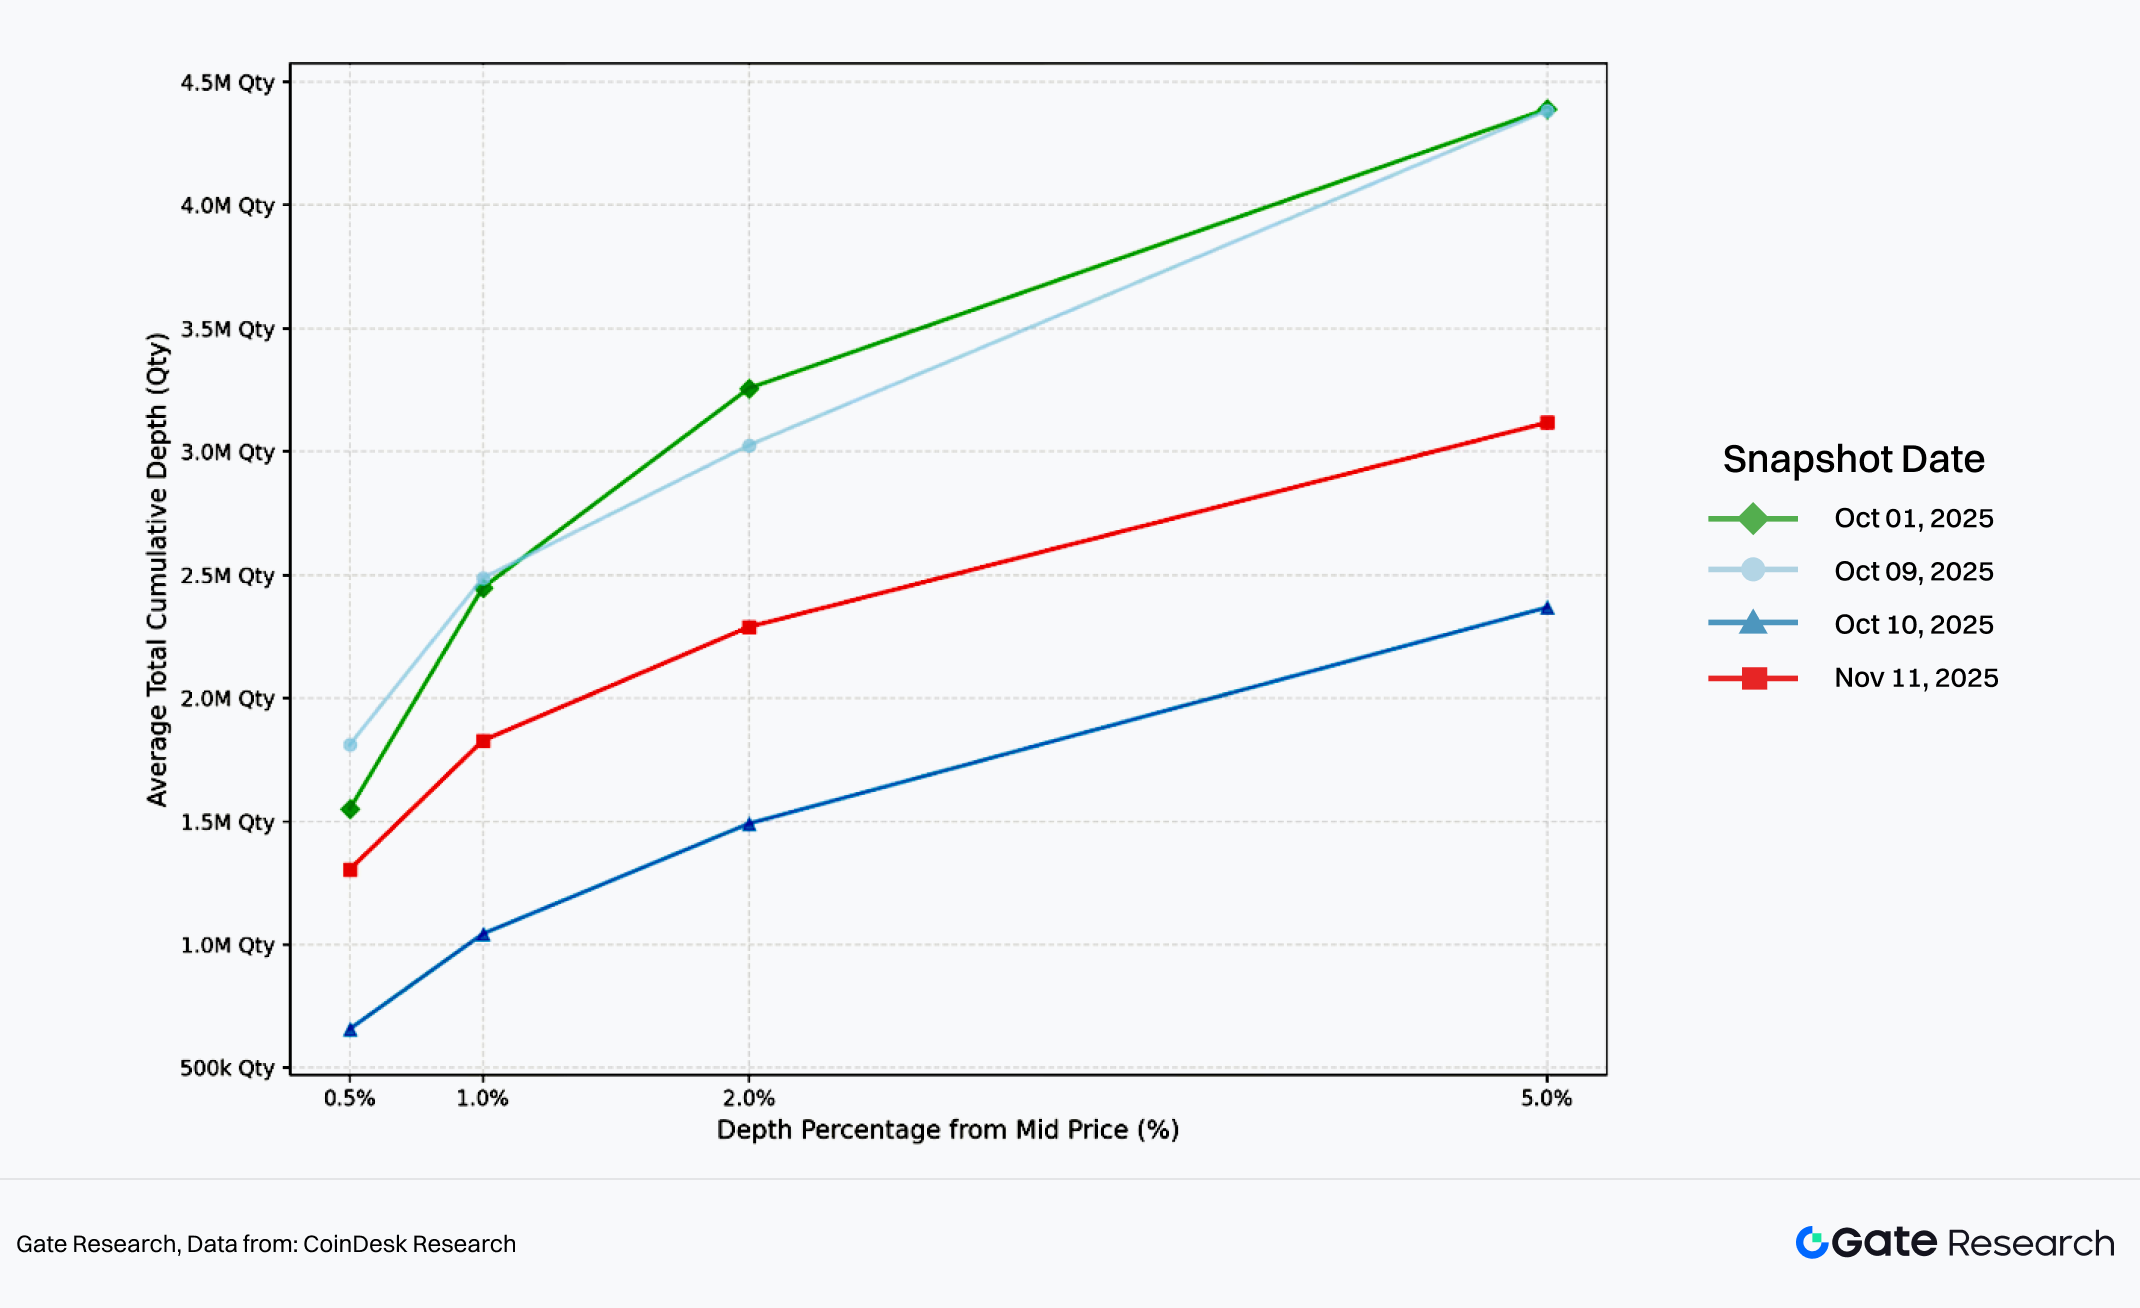
Chat 46: Alts (SOL/XRP/ATOM/ENS) Average Total Liquidity Comparison by Date
Data From:Coindesk Research
Futures Open Interest (OI) Dropped Sharped and Continues to Decrease:
- Since the Oct 11 flash crash, BTC Open Interest (OI) on mainstream exchanges dropped sharply from a daily average of around $90B to around $60B, and remains in a downward trend.
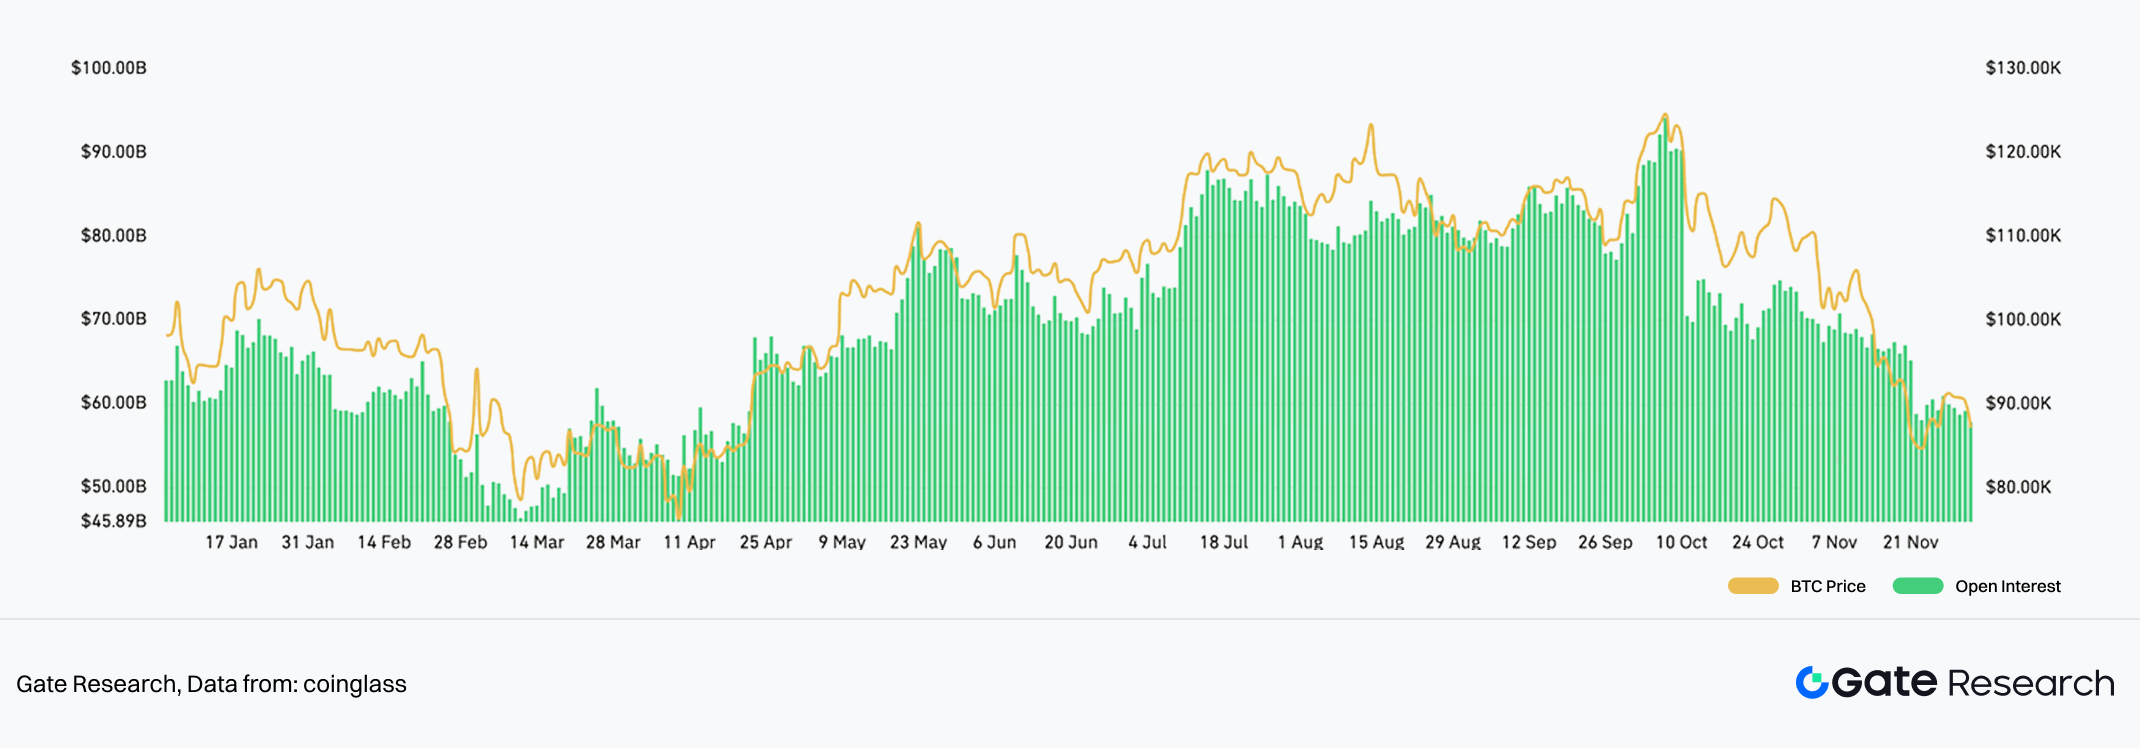
Chart 47: Exchange BTC Open Interest (USD)
Data From:Coinglass
Market Speculative Demand Remains Strong:
Although futures OI decreased, overall futures trading volume did not differ significantly from the period before Oct 11. The futures-to-spot ratio, total futures volume ratio, and daily futures volume changes did not show significant changes, indicating that the Oct 11 flash crash did not cause structural impact on trading in the futures market.
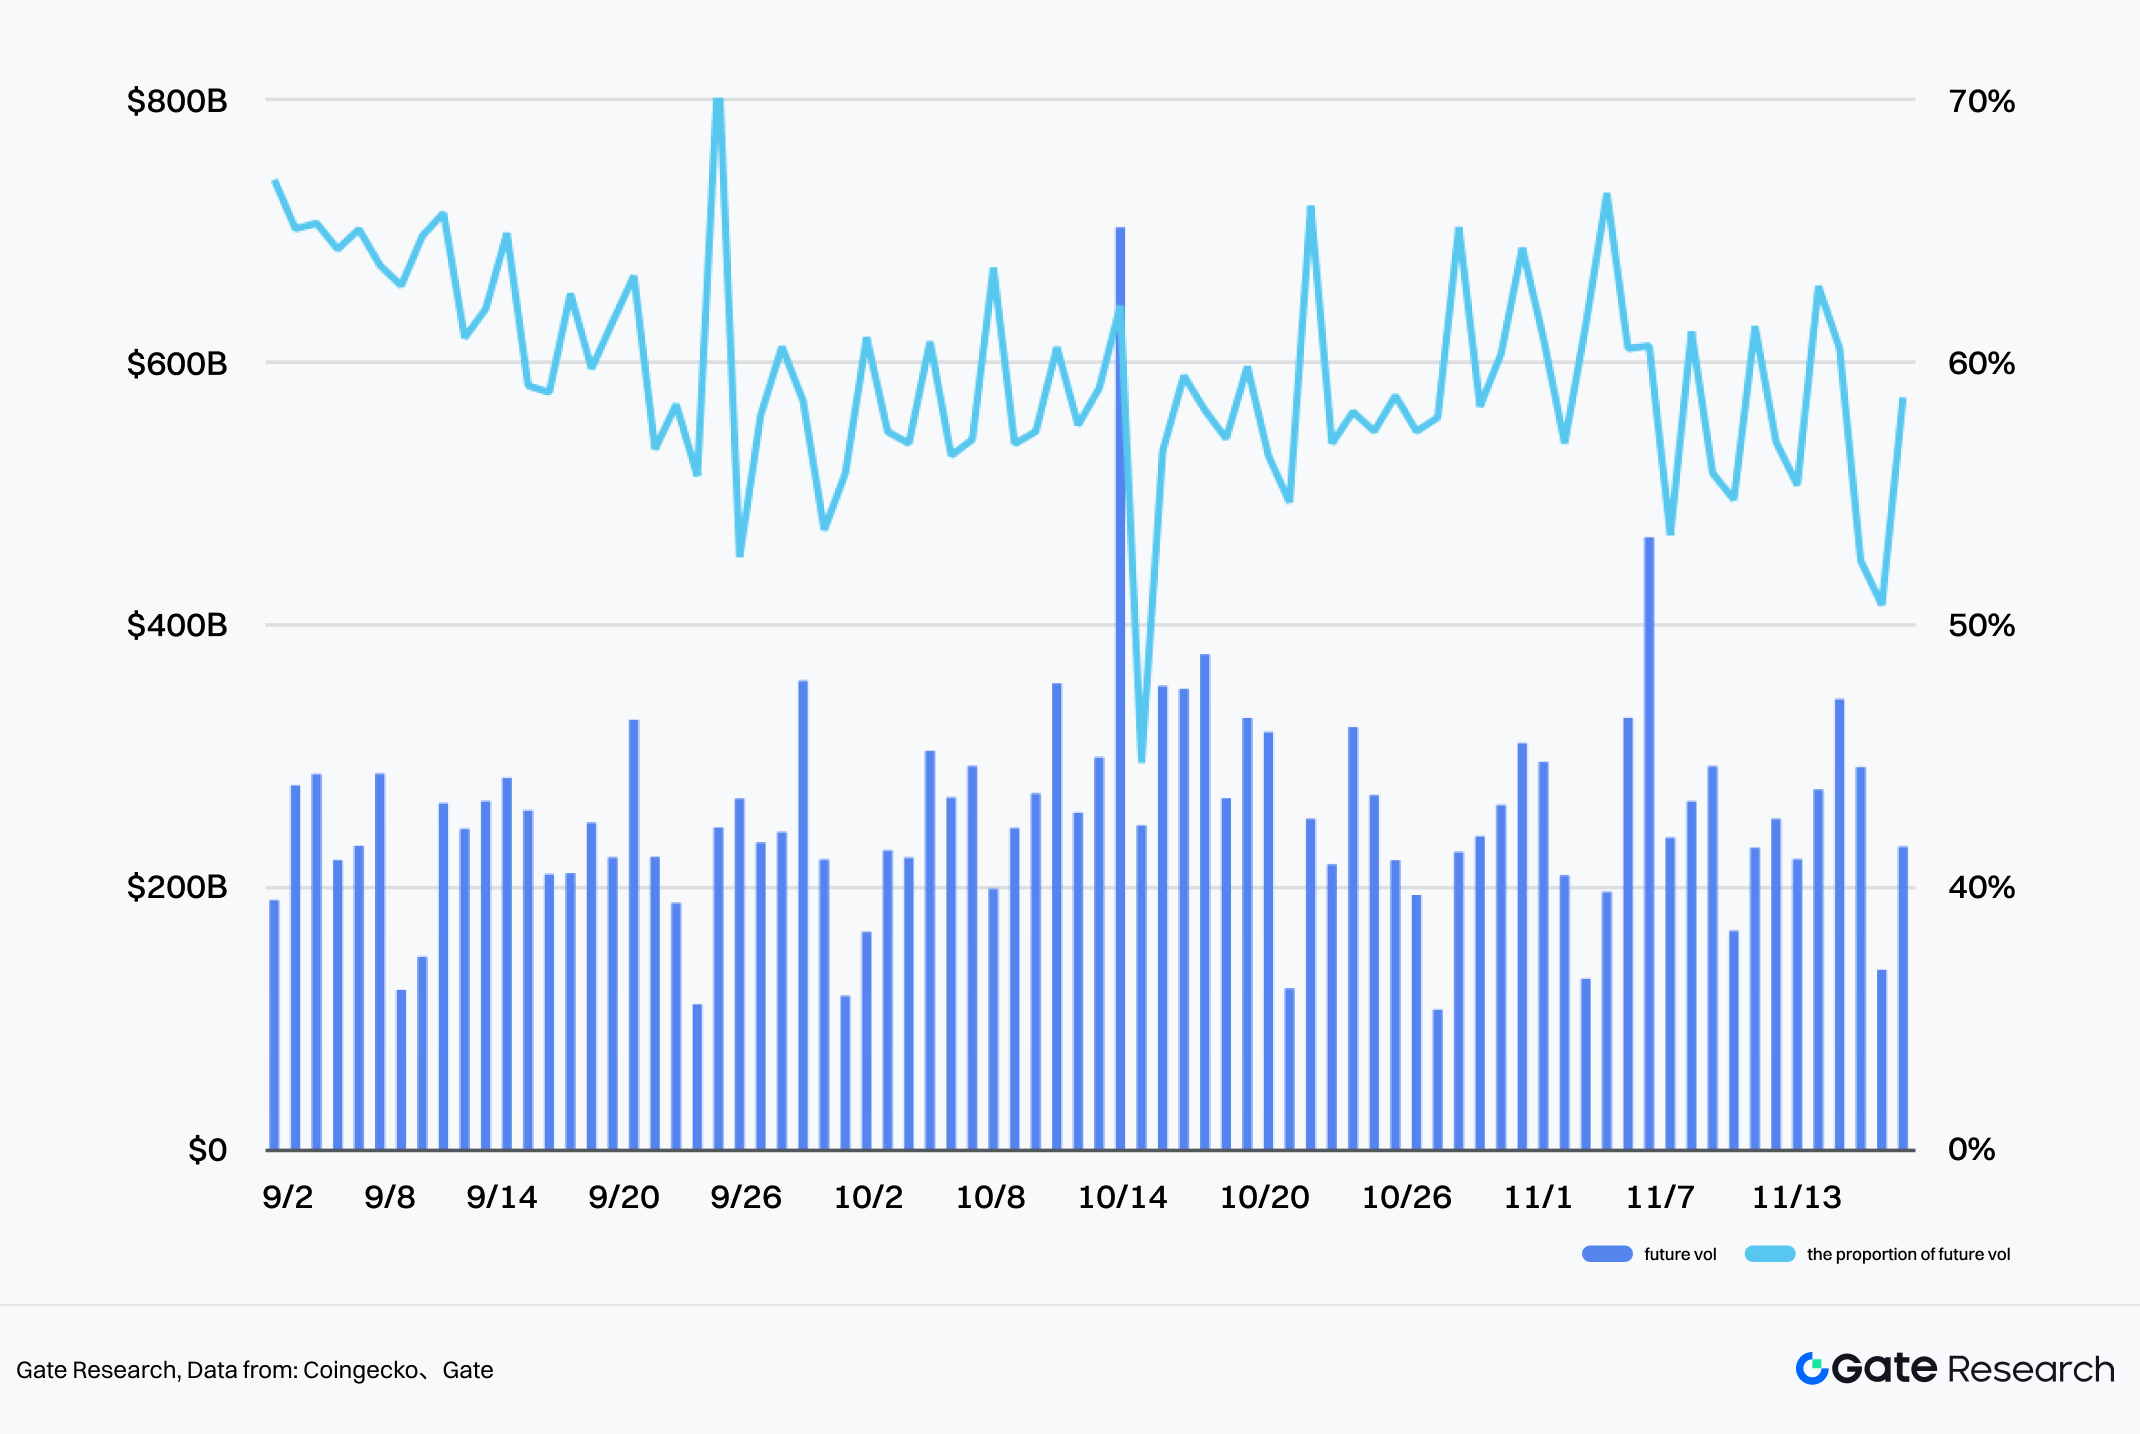
Chart 48: The futures trading volume data in the cryptocurrency market since September 2025
Data From:Coingecko、gate
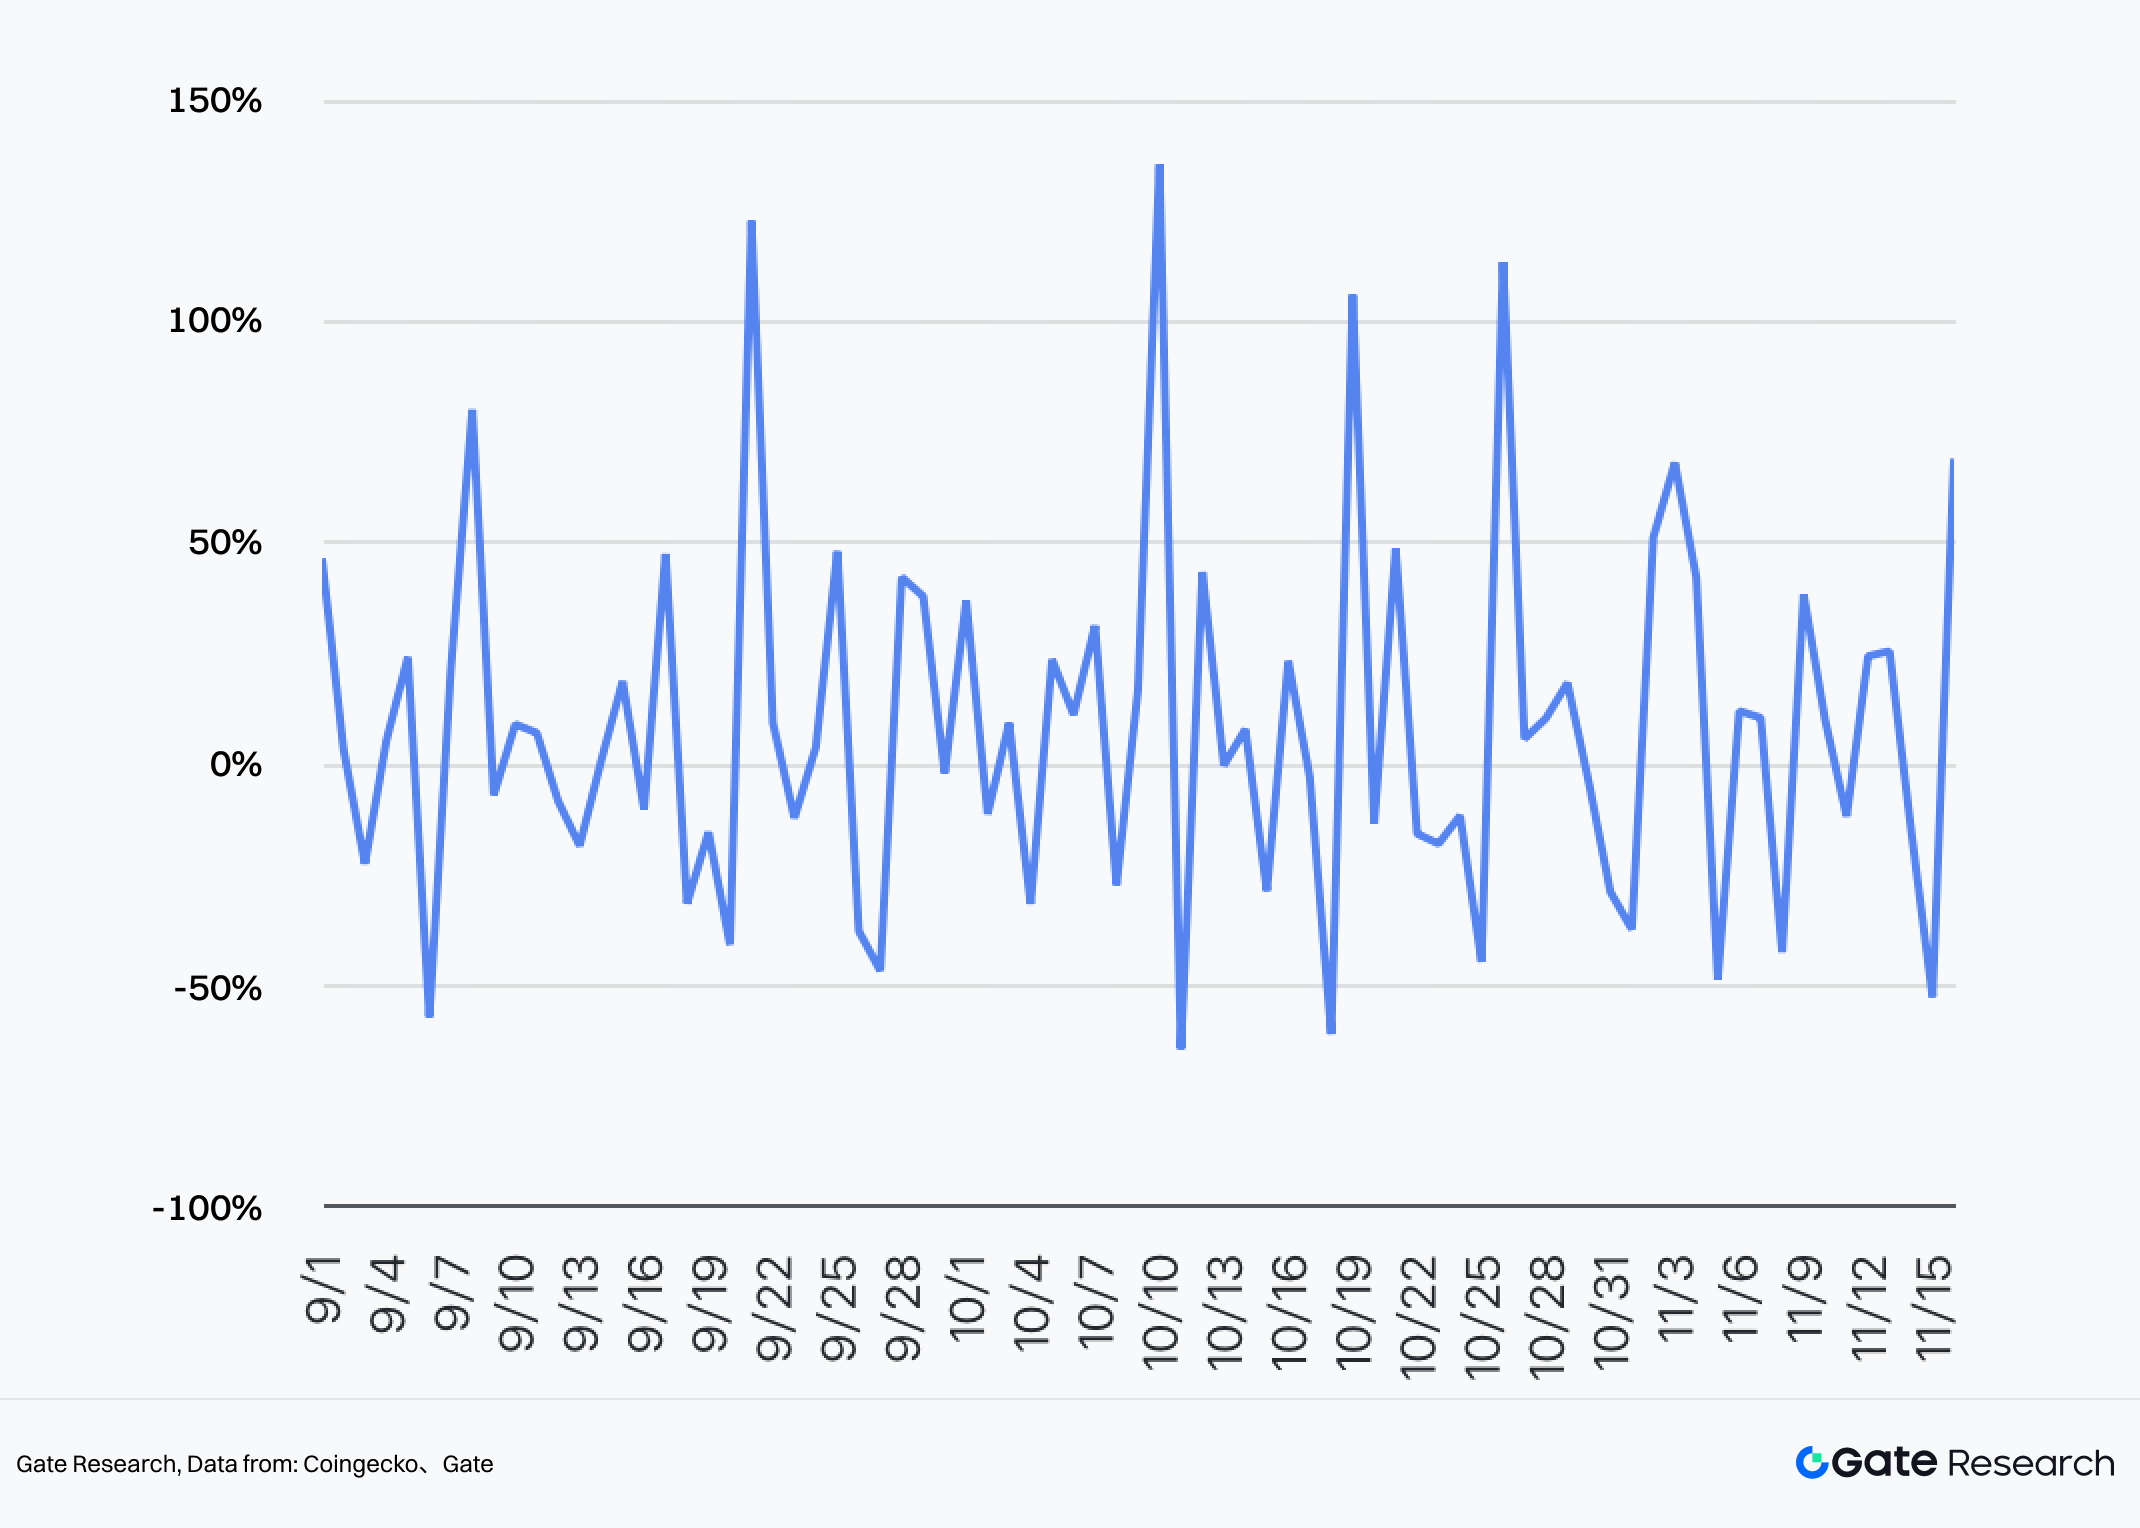
Chart 49: The daily trading volume change of futures in the cryptocurrency market since September 2025
Date From:Coingecko,Gate
IV. Incremental Logic and Emerging Sectors: New Reservoirs for Liquidity
Core Logic: In a macro environment where high inflation recedes but fiscal deficits remain high and geopolitical uncertainties exist, asset allocation behavior shows distinct differentiation. Meanwhile, the Web3 ecosystem did not see the expected “liquidity flood.” The 2025 crypto market is characterized by “Structural Migration Under Aggregate Scarcity”—liquidity is settling from pure narrative bubbles into sectors capable of Real Yield and financial infrastructure functions.
1. On-Chain Liquidity: “Safe-Haven and Yield-Bearing” in a Zero-Sum Game
- Aggregate Feature: The simple logic of “Rate Cuts = Bull Market” failed on-chain. Network-wide TVL annual growth was only +4.4%. Big money did not flow to high-risk protocols but prioritized Gold and traditional tech stocks (AI).
- Structural Highlight: The RWA/Stablecoin sector carved an independent path, maintaining high speed growth for three years, ranking second in the industry with $9.42B net inflow in 2025.
- Evolution Direction: This data confirms that on-chain demand is shifting from “Trading Games” to “Compliant Yield” and “Payment Settlement (PayFi).” Stablecoins are no longer just safe havens but core infrastructure bridging the real world (Treasury yields) and on-chain financial interoperability.
2. Primary Market Liquidity: V-Shaped Reversal and Sector Rotation
- Capital Return: The primary market showed a significant V-shaped reversal. As macro uncertainty cleared, capital accelerated its return, with October financing alone reaching $3.6B, exceeding Q2/Q3 quarterly levels.
- Sector Siphoning: DeFi remains the king of fundraising, with $2.39B in October alone, showing continued capital bets on financial infrastructure innovation.
- Narrative Iteration: Capital switched rapidly between hotspots, forming a clear rotation path: from early-year AI (DeFAI) to mid-year Launchpad/Meme, and finally to year-end Stablecoin Chains, Perp DEXs, Privacy, and Prediction Markets. This indicates the primary market is trying to find a new balance between “Traffic Entry Points” and “High-Frequency Trading Scenarios.”
3. Secondary Market Liquidity: Stratification Intensifies and Derivatives Rise
Market Cap Performance: The market presents “Robust Indices, Bleeding Long-Tail.” As of Nov 17, total crypto market cap oscillates narrowly between $3.4T and $3.38T. Only BTC (+14.57%) and ETH (+7.9%) achieved annual gains. Overall market depth (BTC down 1/3, Altcoin 1% depth down from $2.5M to $1M) and futures OI ($90B down to $60B) dropped sharply following the Oct 11 flash crash, with many altcoins facing liquidity exhaustion.
Microstructure Innovation: Liquidity is shifting to more efficient trading forms:
- a. Asset Transition Mechanism: The “Binance Alpha >> Futures >> Spot” project “gauntlet run” has become the main funnel for liquidity screening.
- b. On-Chain Derivatives Explosion: On-chain trading experience improved drastically. Hyperliquid and other top protocols saw their futures volume ratio to Binance soar from 2.52% to 10%+, with competitors like Aster emerging, reshaping the “DEX vs CEX” competitive landscape.
- c. *Asset Forms: Exploration of on-chain stocks and RWA assets further enriched secondary market trading targets.
V. 2026 Market Outlook: From “Volatility-Driven” to “Structure-Driven” New Cycle
The key variable for the market in 2026 is no longer simply the “magnitude of rate cuts,” but “whether liquidity can be effectively transmitted to risk assets through compliant channels.” The market will bid farewell to the “Volatility-Driven” mode of the wild era and enter a “Structure-Driven” new cycle dominated by institutional pricing power and compliant asset pools.
1. Dual Drive of Macro and Policy
- Liquidity Transmission: If the Fed’s rate cut cycle is accompanied by an economic soft landing, risk appetite is expected to be substantially repaired.
- Compliance Cornerstone: With the implementation of the US GENIUS Act and EU MiCA frameworks, entry barriers for traditional institutions will be cleared legally. Sustained ETF net inflows will no longer be short-term hotspots but long-term Cornerstones supporting a bull market.
2. The Great Bifurcation of Asset Structure
- Matthew Effect: The market will further polarize. The market cap dominance of BTC and Stablecoins will continue to expand, serving as the system’s ballast.
- Survival of the Fittest: Only sectors with substantial technological implementation or revenue-generating capabilities (Cash Flow) (like RWA, Prediction Markets, DeFi) can continuously sustain institutional and retail funds. Long-tail altcoins lacking business logic support will face irreversible liquidity exhaustion.
3. “Derivatization” of Market Microstructure
- Pricing Power Transfer: It is expected that by 2026, the proportion of futures trading will gradually climb to 70%. Institutions will widely use on-chain perpetual contracts for hedging and Basis Trading, meaning spot prices will gradually shift to a process dominated by the derivatives market.
- Risk Warning: The 10.11 flash crash has sounded the alarm—in on a market dominated by high leverage, instant exhaustion of liquidity depth (Liquidity Fragility) will be a major systemic risk in the new normal. One must be wary of extreme volatility caused by “deleveraging.”
Note: This report revolves around the core variable of “Liquidity,” unfolding from three levels: Macro Liquidity (Monetary Policy & Risk Appetite), Market Liquidity (Primary Financing Scale & Trends, Secondary Trading Depth & Pricing Mechanisms), and On-Chain Liquidity (TVL & Stablecoin/RWA Sedimentation). To avoid bias from “single indicator explanation,” we simultaneously observed: Market Structure (Market Share, Sector Rotation), Trading Behavior (Spot/Futures Ratio, OI & Liquidations), and Capital Supply (ETF Inflows, VC Financing, Stablecoin Supply & RWA TVL). Data sources are primarily public data from Coingecko, DefiLlama, RootData, Dune, The Block, CoinGlass, etc., cited in the original draft; some key conclusions are cited from third-party institutional annual reports.
Related Articles

The Future of Cross-Chain Bridges: Full-Chain Interoperability Becomes Inevitable, Liquidity Bridges Will Decline

Solana Need L2s And Appchains?

Sui: How are users leveraging its speed, security, & scalability?

Navigating the Zero Knowledge Landscape

What is Tronscan and How Can You Use it in 2025?